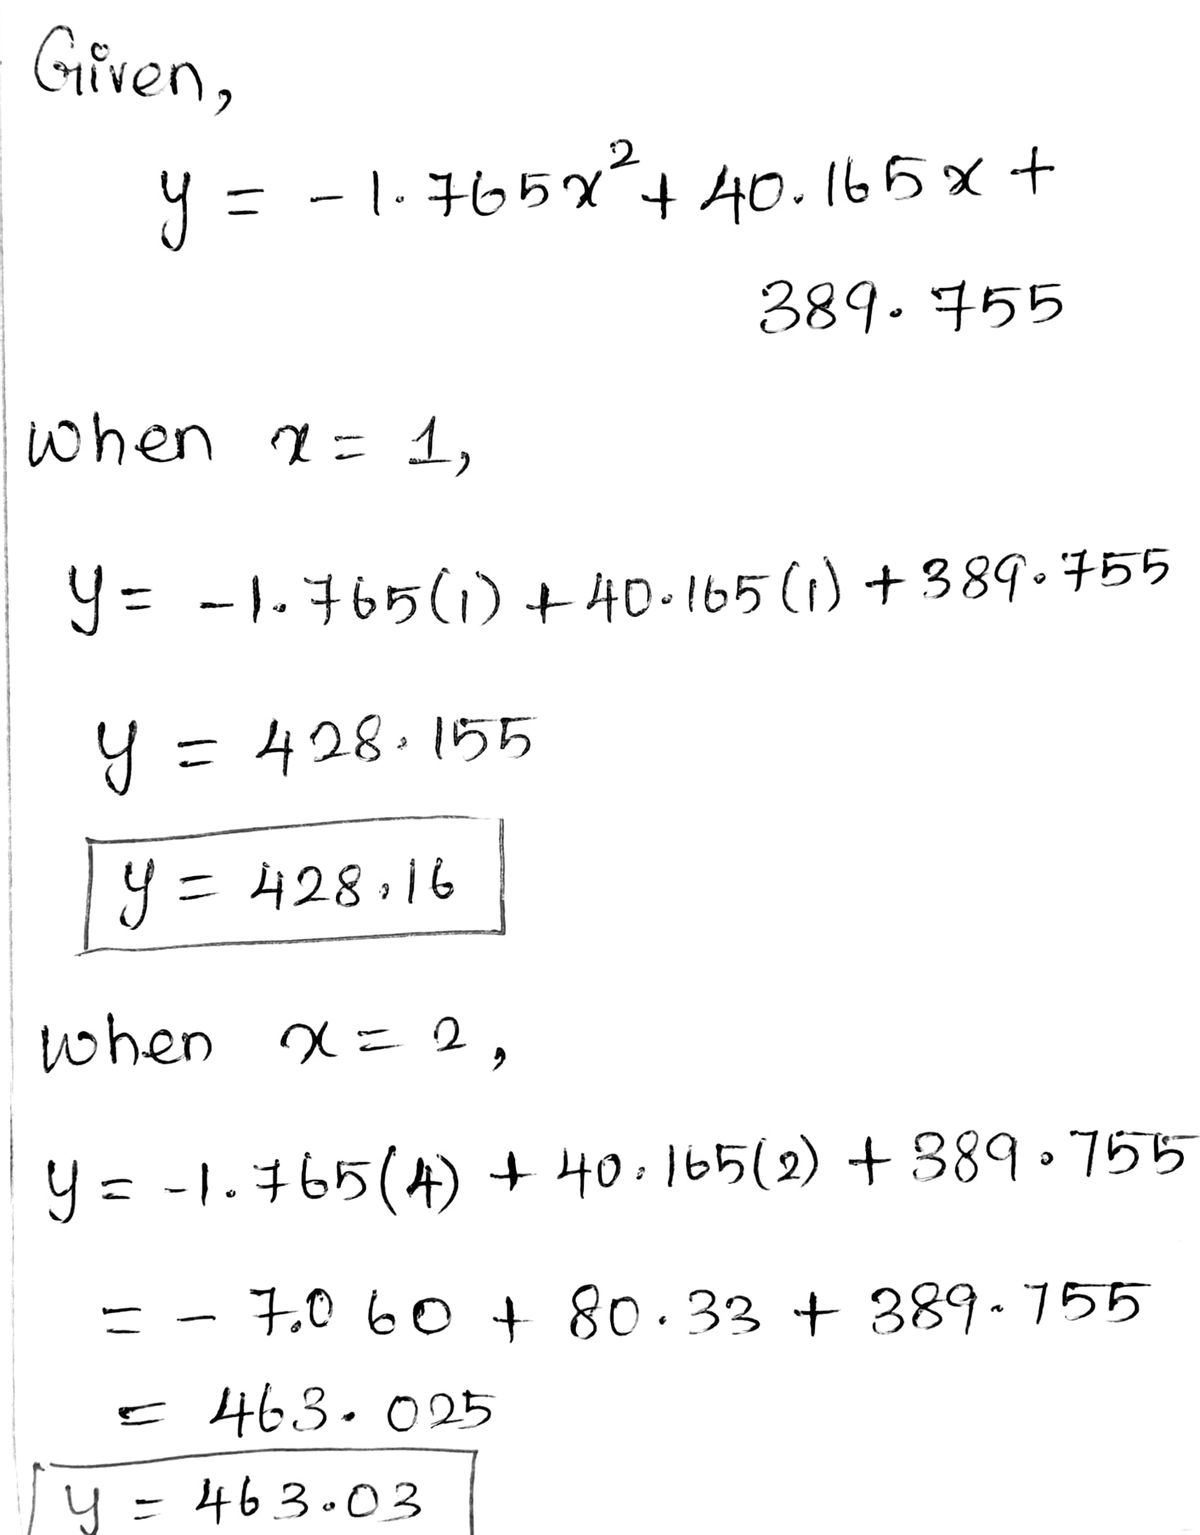
Graph the function y=-1.765x2 + 40.165x + 389.755 for x-values between 1 and 10. Determine the viewing window to graph this function for x-values between 1 and 10, find the corresponding y-values. Complete the following table.
I have a problem that I'm trying to figure out how to solve.
Graph the function y=-1.765x2 + 40.165x + 389.755 for x-values between 1 and 10. Determine the viewing window to graph this function for x-values between 1 and 10, find the corresponding y-values. Complete the following table.
X 1 10
y=-1.765x2 +140.165x+389.755 428.16 614.91
I was able to figure out the answer under 1 (428.16) on my own using the formula. However, I can figure out how the answer under 10 (614.91) was found. Can you please give me specific step-by-step instructions on how to find that specific answer?
Thank you.
We have to calculate the values of "y" by applying the values of "x".

Step by step
Solved in 3 steps with 3 images


