
Calculus: Early Transcendentals
8th Edition
ISBN:9781285741550
Author:James Stewart
Publisher:James Stewart
Chapter1: Functions And Models
Section: Chapter Questions
Problem 1RCC: (a) What is a function? What are its domain and range? (b) What is the graph of a function? (c) How...

Related questions
Question

Transcribed Image Text:The image contains three graphs labeled as options c, d, and e.
**Graph c:**
- This graph displays a sinusoidal wave, suggesting it represents a trigonometric function, likely either sine or cosine.
- The x-axis ranges from -3 to 3, and the y-axis ranges from -2 to 2.
- The wave oscillates above and below the x-axis, completing one full cycle within this range.
**Graph d:**
- This graph appears to represent a horizontal line, indicating a constant function.
- The x-axis ranges from -6 to 6, and the y-axis remains at 0.
- The line is exactly along the x-axis, signifying that the output value does not change regardless of the input.
**Graph e:**
- This graph illustrates a curve with a vertical asymptote and a horizontal asymptote, typical of a rational function.
- The x-axis ranges from -2 to 2 and seems to curve dramatically as it approaches these bounds.
- The y-axis ranges from -12 to 12. The curve appears to approach infinity as x approaches a certain point, characteristic of asymptotic behavior.
These graphs serve as visual aids for understanding the behavior and properties of different mathematical functions.

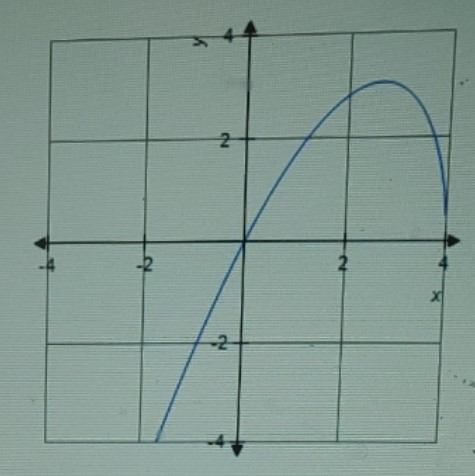
Transcribed Image Text:The image displays a problem involving the graph of a function's derivative, \( f' \).
### Graph Description:
1. **First Graph**:
- This graph is of the function \( f' \).
- The graph plots a curve that starts from the bottom left, rises to a peak around \( x = 3 \), and then descends towards \( x = 5 \).
- The inflection points appear around the relative maximum.
2. **Multiple Choice Options**:
- **Option a**:
- The graph shows a curve that starts at around \( y = 4 \) on the left side and asymptotically approaches zero on the right.
- It has a steep curve heading downwards from left to right.
- **Option b**:
- This graph is a horizontal line at approximately \( y = 1 \).
- The line is straight, indicating no change along the x-axis.
### Task:
- **Select one**:
- \( \circ \) a.
- \( \circ \) b.
This problem involves understanding the derivatives of functions and interpreting their graphical representations. By analyzing the graphs, one can determine the behavior of a function based on its derivative.
Expert Solution
Step 1
The graph of the function is
To Sketch: The graph of the derivative

Step by step
Solved in 2 steps with 2 images

Recommended textbooks for you
Calculus: Early Transcendentals
Calculus
ISBN:
9781285741550
Author:
James Stewart
Publisher:
Cengage Learning

Thomas' Calculus (14th Edition)
Calculus
ISBN:
9780134438986
Author:
Joel R. Hass, Christopher E. Heil, Maurice D. Weir
Publisher:
PEARSON

Calculus: Early Transcendentals (3rd Edition)
Calculus
ISBN:
9780134763644
Author:
William L. Briggs, Lyle Cochran, Bernard Gillett, Eric Schulz
Publisher:
PEARSON
Calculus: Early Transcendentals
Calculus
ISBN:
9781285741550
Author:
James Stewart
Publisher:
Cengage Learning
Thomas' Calculus (14th Edition)
Calculus
ISBN:
9780134438986
Author:
Joel R. Hass, Christopher E. Heil, Maurice D. Weir
Publisher:
PEARSON
Calculus: Early Transcendentals (3rd Edition)
Calculus
ISBN:
9780134763644
Author:
William L. Briggs, Lyle Cochran, Bernard Gillett, Eric Schulz
Publisher:
PEARSON

Calculus: Early Transcendentals
Calculus
ISBN:
9781319050740
Author:
Jon Rogawski, Colin Adams, Robert Franzosa
Publisher:
W. H. Freeman


Calculus: Early Transcendental Functions
Calculus
ISBN:
9781337552516
Author:
Ron Larson, Bruce H. Edwards
Publisher:
Cengage Learning