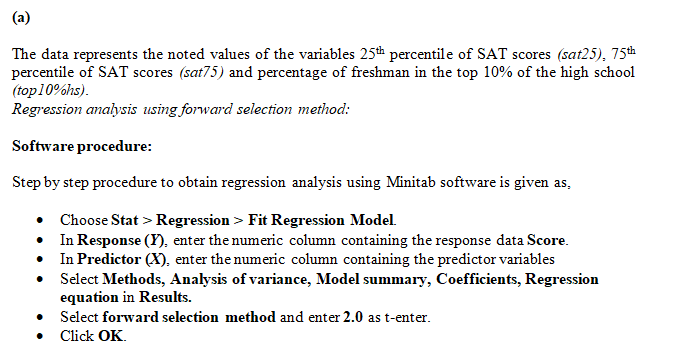
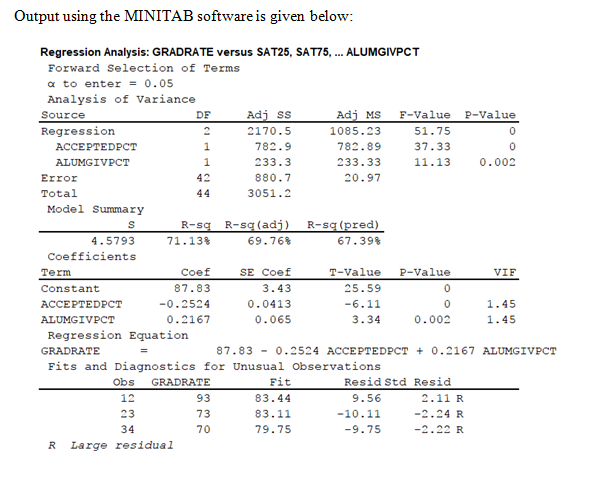
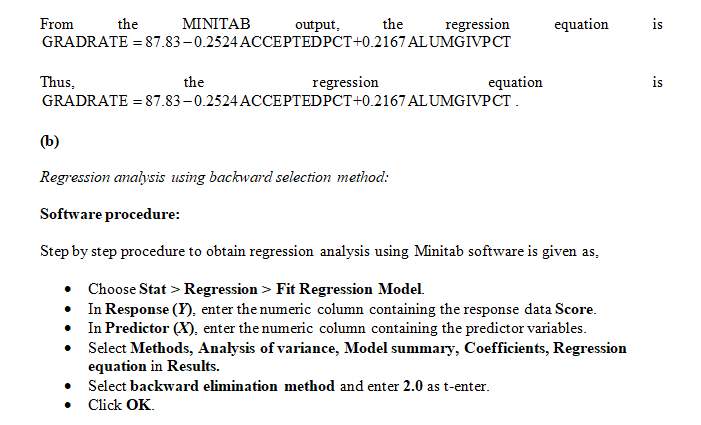
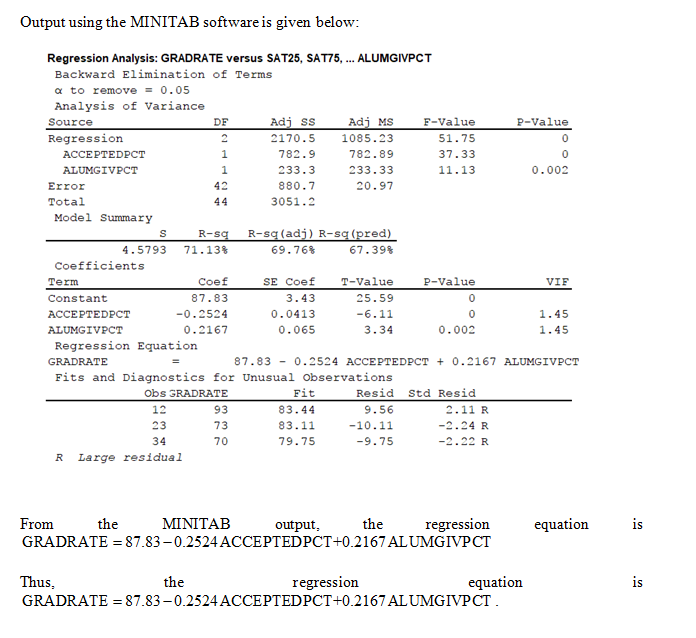
Graduation Rates. Where we considered the regression analysis of graduation rate on the 25th percentile of SAT scores for entering students, the 75th percentile of SAT scores for entering students, the percentage of freshmen in the top 10% of their high school class, the student-to-faculty ratio, the percentage of applicants accepted, and the percentage of alumni giving to the college. a. Use the forward selection method to obtain a regression equation for the data. (Take tenter = 2.00, αenter = 0.05.) b. Use the backward elimination method to obtain a regression equation for the data. (Take tremove = 2.00, αremove = 0.05.) c. Use stepwise regression to obtain a regression equation for these data. (Take tenter = tremove = 2.00, αenter = αremove = 0.05.) d. Are the regression equations obtained in parts (a), (b), and (c) the same? e. For the regression equation selected by stepwise regression in part (c), obtain plots of residuals versus fitted values, residuals versus the included predictor variables, and a normal probability plot of the residuals. Perform a residual analysis to assess the appropriateness of the regression equation, constancy of the conditional standard deviations, and normality of the conditional distributions. Check for outliers and influential observations.
Compound Probability
Compound probability can be defined as the probability of the two events which are independent. It can be defined as the multiplication of the probability of two events that are not dependent.
Tree diagram
Probability theory is a branch of mathematics that deals with the subject of probability. Although there are many different concepts of probability, probability theory expresses the definition mathematically through a series of axioms. Usually, these axioms express probability in terms of a probability space, which assigns a measure with values ranging from 0 to 1 to a set of outcomes known as the sample space. An event is a subset of these outcomes that is described.
Conditional Probability
By definition, the term probability is expressed as a part of mathematics where the chance of an event that may either occur or not is evaluated and expressed in numerical terms. The range of the value within which probability can be expressed is between 0 and 1. The higher the chance of an event occurring, the closer is its value to be 1. If the probability of an event is 1, it means that the event will happen under all considered circumstances. Similarly, if the probability is exactly 0, then no matter the situation, the event will never occur.
Graduation Rates. Where we considered the
a. Use the forward selection method to obtain a regression equation for the data. (Take tenter = 2.00, αenter = 0.05.)
b. Use the backward elimination method to obtain a regression equation for the data. (Take tremove = 2.00, αremove = 0.05.)
c. Use stepwise regression to obtain a regression equation for these data. (Take tenter = tremove = 2.00, αenter = αremove = 0.05.)
d. Are the regression equations obtained in parts (a), (b), and (c) the same?
e. For the regression equation selected by stepwise regression in part (c), obtain plots of residuals versus fitted values, residuals versus the included predictor variables, and a normal probability plot of the residuals. Perform a residual analysis to assess the appropriateness of the regression equation, constancy of the conditional standard deviations, and normality of the conditional distributions. Check for outliers and influential observations.


Step by step
Solved in 2 steps with 10 images


