Graduation Rates. Use the technology of your choice to perform the tests of hypotheses in parts (a) and (b).


Graduation Rates. Use the technology of your choice to perform the tests of hypotheses in parts (a) and (b).
a.
Assess whether the data provides sufficient evidence to conclude at 5% significance level that percentage of freshmen in the top 10% of their high school class is useful for predicting graduation rate.
The data gives graduation rates for colleges and universities (y), calculated as the percentage of freshmen who enter, attend the course full-time and graduate within 5 years, along with their student-to-faculty ratio (x1), percentage of freshmen in the top 10% of their high school class (x2) and percentage of accepted applicants (x3).
Regression:
Procedure to perform the test using Minitab software is given as,
- Choose Stat > Regression > Regression > Fit Regression Model.
- Under Responses, enter the column of Graduation rate (y).
- Under Continuous predictors, enter the columns of Student/faculty ratio (x1), Top 10% HS class (%) (x3), Accepted (%) (x3).
- Click Results and select options Method, Analysis of variance, Model summary, Coefficients, Regression equation and click OK.
- Click OK.
The output using Minitab software is given as,
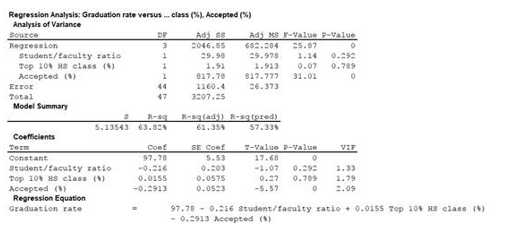
The hypotheses are stated as given below:
Null hypothesis:
H0:β2=0
That is, percentage of freshmen in the top 10% of their high school class is not useful for predicting graduation rate.
Alternative hypothesis:
Ha:β2≠0.
That is, percentage of freshmen in the top 10% of their high school class is useful for predicting graduation rate.
Decision rule:
If the P-value of the test is less than the level of significance, reject H0. Otherwise, fail to reject the null hypothesis H0.
Conclusion:
The level of significance is 0.05 and the P-value is 0.789.
Here, P-value greater than level of significance.
That is, P-value(=0.789)>level of significance(0.05).
Thus, the decision is “do not reject the null hypothesis”.
Therefore, at the α=0.05 or level 5% level of significance, the data provides evidence to conclude that percentage of freshmen in the top 10% of their high school class is not useful for predicting graduation rate.

Step by step
Solved in 2 steps with 1 images


