Global occurrence of anti-infectives in contaminated surface waters: Impact of income inequality between countries The following is a histogram of 1995 concentrations of antibiotics from pooled data from different regions in the world (values are log-transformed) (a)Compute the interval (x¯ − 2s, x¯ + 2s). (b)What percentage of the observations fall within the interval in (a)? Justify your answer in one sentence. (c) Find the z-score for a log-concentration of 8. Interpret the z-score
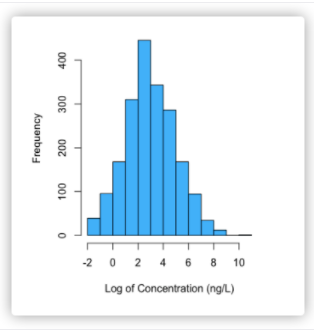
Global occurrence of anti-infectives in contaminated surface waters: Impact of income inequality between countries The following is a histogram of 1995 concentrations of antibiotics from pooled data from different regions in the world (values are log-transformed)
(a)Compute the interval (x¯ − 2s, x¯ + 2s).
(b)What percentage of the observations fall within the interval in (a)? Justify your answer in one sentence.
(c) Find the z-score for a log-concentration of 8. Interpret the z-score


Given,
The histogram of the variables Ferquency and log concentration is given,

n = 1995
To find,
a)Compute the interval (x¯ − 2s, x¯ + 2s).
(b)What percentage of the observations fall within the interval in (a)? Justify your answer in one sentence.
(c) Find the z-score for a log-concentration of 8. Interpret the z-score
Step by step
Solved in 4 steps with 1 images


