Giving a test to a group of students, the grades and gender are summarized below A BC Total Male 13 28 Female 20 19 41 Total 29 32 8 69 If one student is chosen at random, Find the probability that the student did NOT get an "A"
Giving a test to a group of students, the grades and gender are summarized below A BC Total Male 13 28 Female 20 19 41 Total 29 32 8 69 If one student is chosen at random, Find the probability that the student did NOT get an "A"

MATLAB: An Introduction with Applications
6th Edition
ISBN:9781119256830
Author:Amos Gilat
Publisher:Amos Gilat
Chapter1: Starting With Matlab
Section: Chapter Questions
Problem 1P

Related questions
Question
![**Test Results Summary**
A test was administered to a group of students, and their grades are distributed by gender as shown in the table below:
| | A | B | C | Total |
|---------|----|----|---|-------|
| Male | 9 | 13 | 6 | 28 |
| Female | 20 | 19 | 2 | 41 |
| Total | 29 | 32 | 8 | 69 |
**Probability Calculation**
If one student is chosen at random, determine the probability that the student did NOT receive an "A."
_Computation_
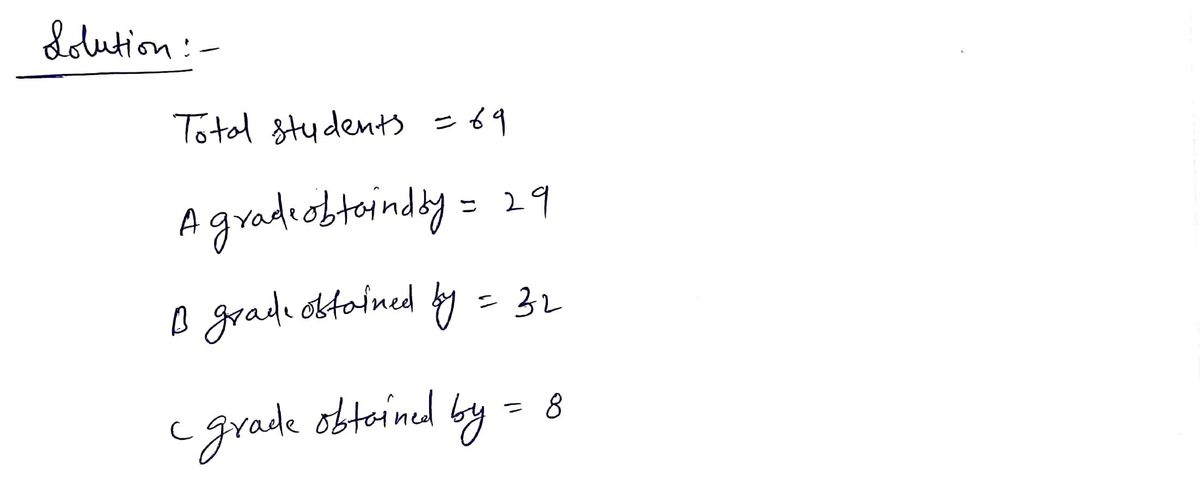
1. Total number of students: 69
2. Number of students who did not receive an A (i.e., received B or C): 32 + 8 = 40
**Probability:**
\[ \text{Probability} = \frac{\text{Number of students who did not receive an A}}{\text{Total number of students}} = \frac{40}{69} \]](/v2/_next/image?url=https%3A%2F%2Fcontent.bartleby.com%2Fqna-images%2Fquestion%2F0645be48-2a82-494d-ae06-198a7d9d9703%2F81cf7ef5-296c-4efe-bfb5-d3202429d573%2Flqjxnvl_processed.png&w=3840&q=75)
Transcribed Image Text:**Test Results Summary**
A test was administered to a group of students, and their grades are distributed by gender as shown in the table below:
| | A | B | C | Total |
|---------|----|----|---|-------|
| Male | 9 | 13 | 6 | 28 |
| Female | 20 | 19 | 2 | 41 |
| Total | 29 | 32 | 8 | 69 |
**Probability Calculation**
If one student is chosen at random, determine the probability that the student did NOT receive an "A."
_Computation_
1. Total number of students: 69
2. Number of students who did not receive an A (i.e., received B or C): 32 + 8 = 40
**Probability:**
\[ \text{Probability} = \frac{\text{Number of students who did not receive an A}}{\text{Total number of students}} = \frac{40}{69} \]
Expert Solution
Step 1

Step by step
Solved in 2 steps with 2 images

Recommended textbooks for you
MATLAB: An Introduction with Applications
Statistics
ISBN:
9781119256830
Author:
Amos Gilat
Publisher:
John Wiley & Sons Inc

Probability and Statistics for Engineering and th…
Statistics
ISBN:
9781305251809
Author:
Jay L. Devore
Publisher:
Cengage Learning

Statistics for The Behavioral Sciences (MindTap C…
Statistics
ISBN:
9781305504912
Author:
Frederick J Gravetter, Larry B. Wallnau
Publisher:
Cengage Learning
MATLAB: An Introduction with Applications
Statistics
ISBN:
9781119256830
Author:
Amos Gilat
Publisher:
John Wiley & Sons Inc
Probability and Statistics for Engineering and th…
Statistics
ISBN:
9781305251809
Author:
Jay L. Devore
Publisher:
Cengage Learning
Statistics for The Behavioral Sciences (MindTap C…
Statistics
ISBN:
9781305504912
Author:
Frederick J Gravetter, Larry B. Wallnau
Publisher:
Cengage Learning

Elementary Statistics: Picturing the World (7th E…
Statistics
ISBN:
9780134683416
Author:
Ron Larson, Betsy Farber
Publisher:
PEARSON

The Basic Practice of Statistics
Statistics
ISBN:
9781319042578
Author:
David S. Moore, William I. Notz, Michael A. Fligner
Publisher:
W. H. Freeman

Introduction to the Practice of Statistics
Statistics
ISBN:
9781319013387
Author:
David S. Moore, George P. McCabe, Bruce A. Craig
Publisher:
W. H. Freeman