Given X:20,15,15,30,15 Find Range, mean of X values(xbar), standard deviation of X,and CV. Use the computational formula to calculate the Variance of X values. Write the governing equations


Inverse Normal Distribution
The method used for finding the corresponding z-critical value in a normal distribution using the known probability is said to be an inverse normal distribution. The inverse normal distribution is a continuous probability distribution with a family of two parameters.
Mean, Median, Mode
It is a descriptive summary of a data set. It can be defined by using some of the measures. The central tendencies do not provide information regarding individual data from the dataset. However, they give a summary of the data set. The central tendency or measure of central tendency is a central or typical value for a probability distribution.
Z-Scores
A z-score is a unit of measurement used in statistics to describe the position of a raw score in terms of its distance from the mean, measured with reference to standard deviation from the mean. Z-scores are useful in statistics because they allow comparison between two scores that belong to different normal distributions.
Given X:20,15,15,30,15 Find
The number of values of X is n=5.
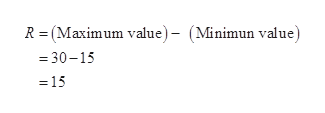
The range of X is calculated below.
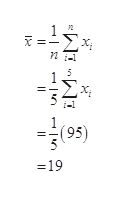
The arithmetic mean of X is calculated below.
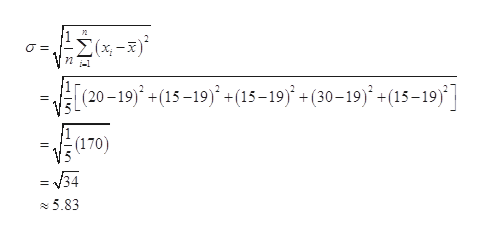
The standard deviation of X is calculated below.

Step by step
Solved in 5 steps with 5 images


