

Q: Physicists know that if each edge of a thin conducting plate is kept at a constant temperature, then…
A: Given: It is given that the temperature at the interior points is the mean of the four surrounding…
Q: es to bake. In the past 100 days, they ha and 140 loaves per day. Here is a histogra of loaves they…
A: Hi! Thank you for the question, As per the honour code, we are allowed to answer three sub-parts at…
Q: THE FF. WERE THE RESULTS OF THE EXAMINATION CONDUCTED FOR GRADUATING STUDENTS. FIND THE MEAN (USE 4…
A: The objective is to compute the mean for the given data.
Q: The bar graphs below show the percentage of students who received each score on their last English…
A: Given the two bar graphs, we need to answer if the standard deviation is larger or smaller for each…
Q: The table to the right classifies a stock's price change as up, down, or no change for both today's…
A: There are two categorical variables which are Price Change Today and Price Change Previous Day. We…
Q: Q29. Explain about equal and unequal distributions.
A: Answer: For the given question,
Q: The graph illustrates the distribution of test scores taken by College Algebra students. The maximum…
A: Given: Maximum score = 130, mean score = µ = 78, standard deviation =σ = 12, Part a:…
Q: (a) Find a 95% confidence interval for the population mean concentration of uric acid in this…
A: Overproduction of uric acid in the body can be an indication of cell breakdown. This may be an…
Q: The average American gets a haircut every 39 days. Do college students get their hair cut less…
A: A hypothesis test is a statistical method that uses sample data to evaluate a hypothesis about a…
Q: For 60 randomly selected college students, exam score frequency distribution was obtained. Find the…
A: Given: class limit frequency 5-10 6 10-15 12 15-20 18 20-25 15 25-30 9
Q: Sam collected data on the number of shots required to finish an eighteen hole round in the videogame…
A: Hello! As you have posted more than 3 sub parts, we are answering the first 3 sub-parts. In case…
Q: Creat a 5-Number Summary and a box plot for one continuous variable. Are there any outliers in that…
A: Introduction: The five-number summary includes the minimum, first quartile, second quartile…
Q: 22 A city's yearly precipitation over a 50- year period is summarized in the box plot. Yearly…
A: Given yearly precipitation is : 10 cm,20 cm,30 cm,40 cm,50 cm,60 cm,70 cm Here the number of terms…
Q: Construct one table that includes relative frequencies based on the frequency distributions shown…
A: Here, we have given some data, then we have to calculate relative frequency for both type of data…
Q: 1. IQ Scores Listed below are the IQ scores of randomly selected statistics professors. What value…
A: ( 1 ) For the given data find mean using Excel what is notable about these values
Q: _____ are often referred to as measures of central tendency. a. Sums b. Ranges c. Frequencies…
A:
Q: one of the following statements is True? A Time Series of data displays the data from least to…
A: From provided statements, the true statement is, a very low Percentile of a data point indicates the…
Q: Three numbers a, b, c are such that a< b< c. The median is 12, the range is 12 and the mean is 14.…
A:
Q: The graph illustrates the distribution of test scores taken by College Algebra students. The maximum…
A: The given information is that the mean score is 74 and standard deviation is 15.
Q: Use the drop-down menus to identify the key values of the box plot. The median is v. The minimum is…
A: to write the median, maximum, minimum, etc values
Q: 6. The probability that a chocolate biscuit is double wrapped is 0.01, and a box contains 150…
A: Discrete Random Variable: A discreate random variable is a variable whose values can be obtained by…
Q: A pediatrician wants to determine the relation that may exist between a child's height and head…
A: Solution: Let x= Height (inches) and y = Head Circumference (inches) x y (x-x) (y-y)…
Q: nd . The Mean . The Medain graphically Cholesterol value Frequency 170 to 189 3 190 to 209 10 210 to…
A:
Q: Measure of variation is. median varance mode All
A: Measure of variation is which measures the spread of distribution such as range and variance…
Q: dasses. Describe any patterns alld a nequency histogram for the data set using the indicated number…
A: The number of times each variety occurs in known as frequency. A classification showing different…
Q: A certain statistics instructor participates in triathlons. The accompanying table lists times (in…
A: Since you have posted a question with multiple subparts, we will solve first three subparts for you.…
Q: The box plot below depicts the median number of hours a population of N = 12 students reported…
A: We have given that the five number summary in box plot. The population of size N = 12 students…
Q: Most adults have a primary care physician who serves as their regular doctor and who coordinates…
A: given data q-1) E = 0.8 σ = 7.2 90% ci for mean, n = ?
Q: 5. The median is larger than the arithmetic mean when a. the distribution is positively skewed. b.…
A: Here's, the median is larger than the arithmetic mean.
Q: approximate the given median given the FDT. show
A: From the given information, Classes f 10-14 2 15-19 6 20-24 4 25-29 8 30-34 3 35-39…
Q: The graph illustrates the distribution of test scores taken by College Algebra students. The maximum…
A: According to the empirical rule, for a Normal distribution with mean μ and standard deviation σ, 68%…
Q: Direction: Find the median of each grouped data. I. Consider the test result in statistics of 50…
A: Since you have posted multiple questions, we will solve the first question for you. If you want any…
Q: Describe how the range of a distribution is defined and calculated. Choose the correct answer below.…
A: Solution: Range of a distribution
Q: The scatterplot illustrates the relationship between Which of the following is an accurate…
A: The objective is to choose correct description about the scatterplot diagram
Q: The graph illustrates the distribution of test scores taken by College Algebra students. The maximum…
A:
Q: The visualization given shows how much time, in hours, the 40 children in Ms. Baker's third grade…
A: Total number of childrens = 40 Frequency table is given.
Q: The graph illustrates the distribution of test scores taken by College Algebra students. The maximum…
A: Hey there! Thank you for posting the question. Since your question has more than 3 parts, we are…
Q: 2.42 Using the easier computational formulas, find (a) the variance and (b) the standard deviation…
A: Given: Table of frequency distribution of gasoline prices is given as below: Price $ Frequency…
Given the graph below. Determine the average rate of change on the interval 0≤x≤4

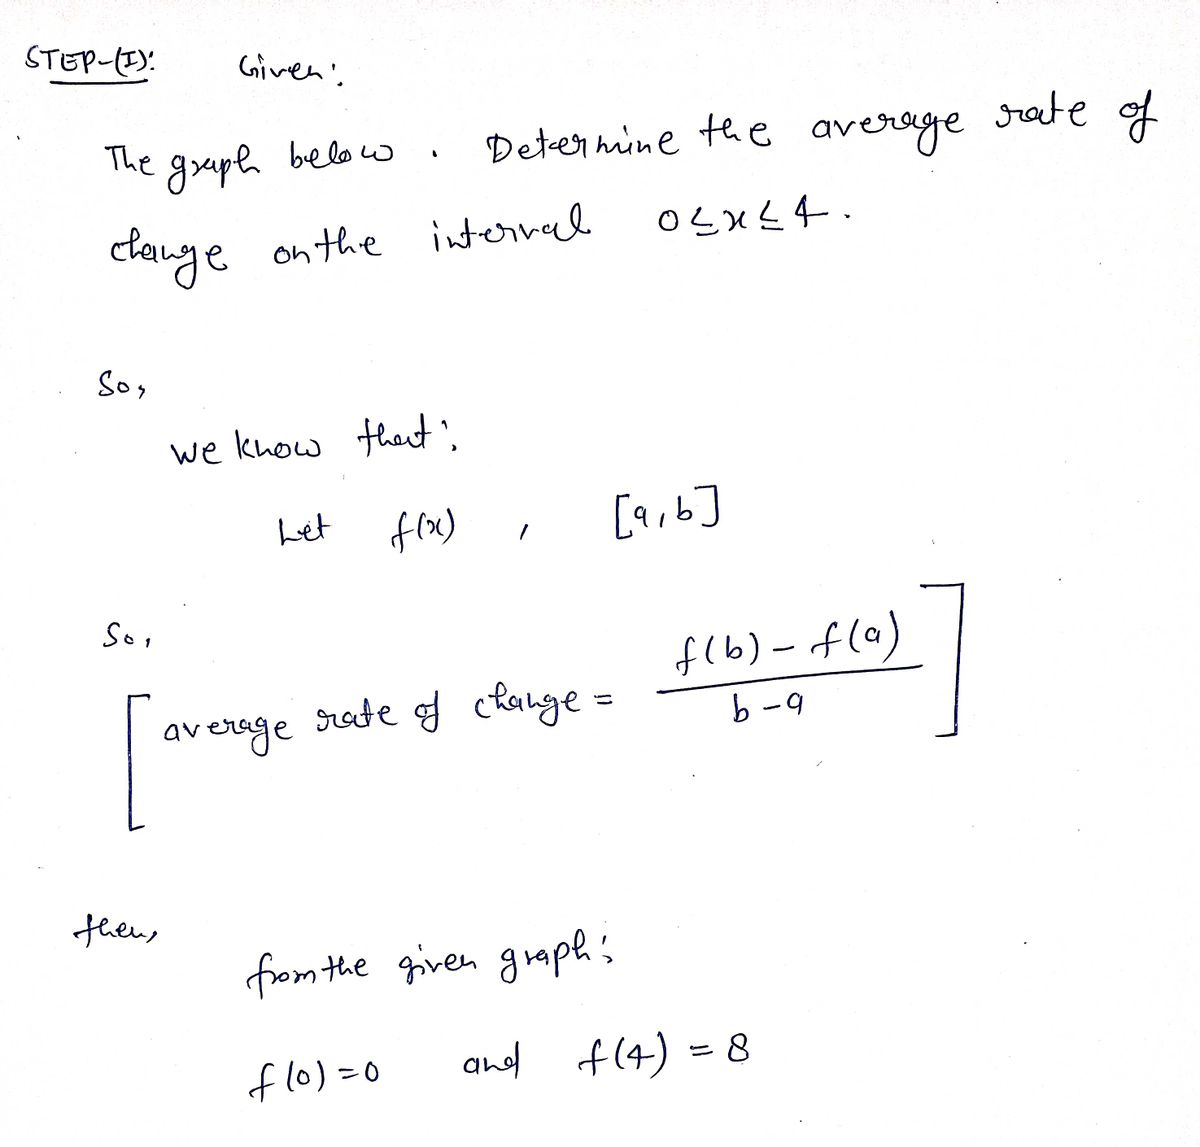

Step by step
Solved in 2 steps with 2 images

- Alice made a survey on the number of active Android applications her classmates have. The table summarizes the results. The Class Intervals contain the numbers of active Android Applications. The frequency is the number of students. Complete the table before answering the questions. Class Frequency Lower Class Boundary (LCB) Less than Cumulative Frequency (< cf) 50 Interval (1) 26-30 3 21-25 13 16-20 10 11-15 15 6-10 8 1-5 1 4129 47 34 1Suppose X - N (8, 2). Between what a values does 68.22% of the data lie? The range of x values is centered at the mean of the distribution (i.e., 8). Enter your answers in increasing order, to the nearest integer. 68.22% of the data lie between Number and NumberDetermine whether the statement is true or false. If it is false, rewrite it as a true statement. As the size of a sample increases, the mean of the distribution of sample means increases. Choose the correct answer below. O A. False. As the size of a sample increases, the mean of the distribution of sample means decreases. B. False. As the size of a sample increases, the mean of the distribution of sample means does not change. O C. True.
- In the given graph, What is the mean and standard deviation?The accompanying data represent the wait time (in minutes) for a random sample of 40 visitors to a popular attraction in a large amusement park. Use the sample data to complete parts (a) through (d). Click the icon to view the data for wait times. (a) Construct a relative frequency histogram of the data. Comment on the shape of the distribution. Choose the correct graph below. O A. ARelative Freq. 0.6- 0+ 60 Wait Time (min.) What is the shape of the distribution? O O E A. Q 60 B. No A. Yes, there is(are) B. A Relative Freq. 0.6 outlier(s). 07 0 60 Wait Time (min.) O A. The distribution is bell-shaped and roughly symmetric about its peak between 25 and 30 minutes. B. The distribution is right-skewed because the peak is between 0 and 5 minutes and the right tail is much longer than the left tail. C. The distribution is left-skewed because the peak is between 55 and 60 minutes and the left tail is much longer than the right tail. D. The distribution is right-skewed because the peak is…**PLEASE READ AND ACTUALLY ANSWER ALL QUESTIONS - THE LAST RESPONSE THIS QUESTION ANSWERED ONE OF FOUR. TOTAL CRAP** What is the income distribution of super shoppers? A supermarket super shopper is defined as a shopper for whom at least 70% of the items purchased were on sale or purchased with a coupon. In the following table, income units are in thousands of dollars, and each interval goes up to but does not include the given high value. The midpoints are given to the nearest thousand dollars. Income range 5-15 15-25 25-35 35-45 45-55 55 or more Midpoint x 10 20 30 40 50 60 Percent of super shoppers 22% 14% 20% 17% 19% 8% (a) Using the income midpoints x and the percent of super shoppers, do we have a valid probability distribution? Explain. Yes. The events are indistinct and the probabilities sum to less than 1.No. The events are indistinct and the probabilities sum to 1. No. The events are indistinct and the probabilities sum to more than 1.Yes. The events are…
- The median and mode of the wage distribution are known to be ₹ 3,350 and ₹ 3,400 respectively. Find the values of f3, f and f5 + No. of Employees Wages (in) 0-1,000 1,000-2,000 2,000-3,000 3,000-4,000 4 16 f3 f4 Wages (in) 4,000-5,000 5,000-6,000 6,000-7,000 Total No. of Employees f5 6 4 230The graph illustrates the distribution of test scores taken by College Algebra students. The maximum possible score on the test was 140, while the mean score was 73 and the standard deviation was 15. 38 73 Distribution of Test Scores 28 43 103 118 What is the approximate percentage of students who scored higher than 118 on the test? % What is the approximate percentage students who scored between 58 and 88 on the test? What is the approximate percentage of students who scored less than 43 on the test? What is the approximate percentage of students who scored between 73 and 88 on the test?answer please
- AsapThe temperatures in °C, at midday in a German city during summer of 2017, were mersured for eight days and the results are recorded below. 21, 12, 15, 12, 24, T, 30, 24 The mean temperature was found to be 21°C. (a) Find the value of T. (b) Write down the mode. (c) Find the median.The graph below displays a fire department's response Which interval contains the median response time? time, which measures the time from when the alarm is O 40-50 seconds sounded at the firehouse to the time the first fire engine leaves the station. 50-60 seconds 60–70 seconds Fire Department Response Times O 70-80 seconds 0.4 0.3 0.2 0.1 10 20 30 40 50 60 70 80 90 Response Time (Seconds). Relative Frequency


