For the following set of data from two independent samples, conduct an independent samples t test (by hand or using SPSS) to determine if the mean scores for each sample are significantly different. Sample 1: 5, 7, 4, 7, 2, 6, 7, 3, 4, 5 Sample 2: 3, 4, 3, 4, 3, 3, 3, 4, 5, 4, 3
For the following set of data from two independent samples, conduct an independent samples t test (by hand or using SPSS) to determine if the mean scores for each sample are significantly different. Sample 1: 5, 7, 4, 7, 2, 6, 7, 3, 4, 5 Sample 2: 3, 4, 3, 4, 3, 3, 3, 4, 5, 4, 3

MATLAB: An Introduction with Applications
6th Edition
ISBN:9781119256830
Author:Amos Gilat
Publisher:Amos Gilat
Chapter1: Starting With Matlab
Section: Chapter Questions
Problem 1P

Related questions
Topic Video
Question
For the following set of data from two independent samples, conduct an independent samples t test (by hand or using SPSS) to determine if the
Sample 1: 5, 7, 4, 7, 2, 6, 7, 3, 4, 5
Sample 2: 3, 4, 3, 4, 3, 3, 3, 4, 5, 4, 3
Expert Solution
Step 1
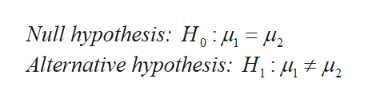
The hypotheses are given below:
Step 2
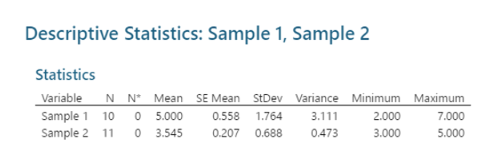
Step-by-step procedure to obtain the mean and standard deviation using MINITAB software:
- Choose Stat > Basic Statistics > Display Descriptive Statistics.
- In Variables enter the columns 8-10 year, 11 and 14 year.
- Choose option statistics, and select Mean and standard deviation.
- Click OK.
Output obtained using MINITAB software is given below:
Step 3
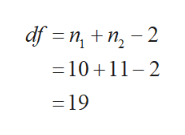
The degrees of freedom is,
Step 4
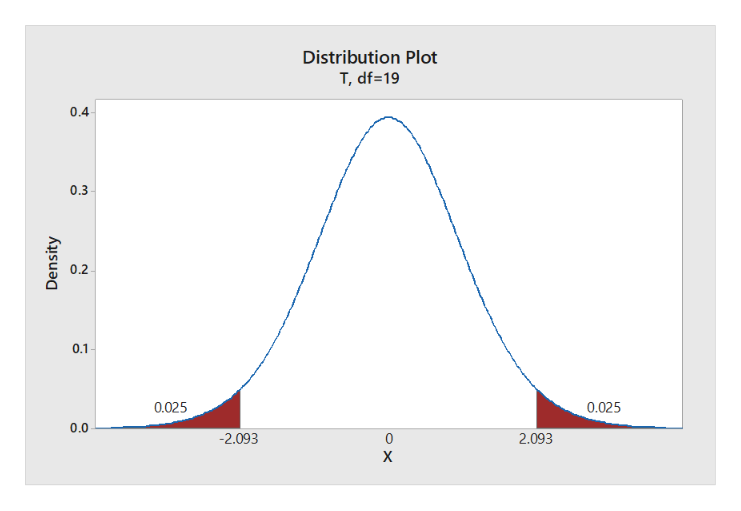
Step-by-step procedure to obtain the critical value using MINITAB software:
- Choose Graph > Probability Distribution Plot choose View Probability > OK.
- From Distribution, choose ‘t’ distribution.
- In Degrees of freedom, enter 19.
- Click the Shaded Area
- Choose Probability and both Tail for the region of the curve to shade.
- Enter the Probability as 0.05.
- Click OK.
Output obtained using MINITAB software is given below:

Trending now
This is a popular solution!

Step by step
Solved in 8 steps with 7 images

Knowledge Booster


Learn more about
Need a deep-dive on the concept behind this application? Look no further. Learn more about this topic, statistics and related others by exploring similar questions and additional content below.Recommended textbooks for you
MATLAB: An Introduction with Applications
Statistics
ISBN:
9781119256830
Author:
Amos Gilat
Publisher:
John Wiley & Sons Inc

Probability and Statistics for Engineering and th…
Statistics
ISBN:
9781305251809
Author:
Jay L. Devore
Publisher:
Cengage Learning

Statistics for The Behavioral Sciences (MindTap C…
Statistics
ISBN:
9781305504912
Author:
Frederick J Gravetter, Larry B. Wallnau
Publisher:
Cengage Learning
MATLAB: An Introduction with Applications
Statistics
ISBN:
9781119256830
Author:
Amos Gilat
Publisher:
John Wiley & Sons Inc
Probability and Statistics for Engineering and th…
Statistics
ISBN:
9781305251809
Author:
Jay L. Devore
Publisher:
Cengage Learning
Statistics for The Behavioral Sciences (MindTap C…
Statistics
ISBN:
9781305504912
Author:
Frederick J Gravetter, Larry B. Wallnau
Publisher:
Cengage Learning

Elementary Statistics: Picturing the World (7th E…
Statistics
ISBN:
9780134683416
Author:
Ron Larson, Betsy Farber
Publisher:
PEARSON

The Basic Practice of Statistics
Statistics
ISBN:
9781319042578
Author:
David S. Moore, William I. Notz, Michael A. Fligner
Publisher:
W. H. Freeman

Introduction to the Practice of Statistics
Statistics
ISBN:
9781319013387
Author:
David S. Moore, George P. McCabe, Bruce A. Craig
Publisher:
W. H. Freeman