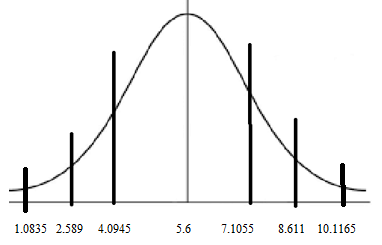
For each set of data, draw and label a normal curve. Specifically, label the mean and each of the standard deviations above and below the mean. Test 1 Test 2 Test 3 3 34 154 7 54 167 5 17 132 4 26 145 5 34 154 6 25 145 7 14 113 8 24 15
For each set of data, draw and label a normal curve. Specifically, label the
Test 1 Test 2 Test 3
3 34 154
7 54 167
5 17 132
4 26 145
5 34 154
6 25 145
7 14 113
8 24 156
6 25 154
5 23 123
Test 1:
Mean=5.6, calculated from the Excel function, =AVERAGE(B4:B13)
Standard deviation(S)=1.5055, calculated from the Excel function, =STDEV.S(B4:B13)
Consider,
Normal curve:

Trending now
This is a popular solution!
Step by step
Solved in 3 steps with 3 images


