For all students who have taken a certain class during the last ten years, the average on the mid-term is 83.4 and the standard deviation of the mid-term scores is 7.2; the average on the final is 79.3 and the standard deviation of the scores on the final is 5.1; the correlation between scores on the mid-term and scores on the final is 0.86. 4. My teacher has lost our mid-term scores (but at least has our scores on the final), so she is fitting a straight line to guess what we probably got on the mid-term. What’s the equation of the line she is using? 5. I got a 90 on the final. What does my teacher think I got on the midterm?


For all students who have taken a certain class during the last ten years, the
average on the mid-term is 83.4 and the standard deviation of the mid-term
scores is 7.2; the average on the final is 79.3 and the standard deviation of the
scores on the final is 5.1; the
scores on the final is 0.86.
4. My teacher has lost our mid-term scores (but at least has our scores on
the final), so she is fitting a straight line to guess what we probably got on
the mid-term. What’s the equation of the line she is using?
5. I got a 90 on the final. What does my teacher think I got on the midterm?
Introduction:
Consider that x is the independent variable and y is the dependent variable. The size of the observations is n.
The formula for sample least-squares regression line is:
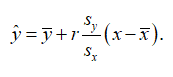
Here, x̄, y̅ are the respective sample means of x and y, sx, sy are the respective sample standard deviations of x and y, and r is the sample correlation coefficient.

Trending now
This is a popular solution!

Step by step
Solved in 3 steps with 3 images


