Following are chest size and weight data for 6 randomly selected bears. Here, x denotes chest size, in inches, and y denotes weight, in pounds. Use the information to complete parts (a) through (f). 55 329 54 O 40 256 333 44 46 58 346 y 276 270 c. Describe the apparent relationship between the two variables. O A. Weight tends to increase as chest size increases. O B. Weight tends to decrease as chest size increases. O. Weight remains constant as chest size increases. OD. There is no apparent relationship between weight and chest size. d. Identify the predictor and response variables. O A. The predictor variable is chest size and the response variable is weight. OB. The predictor variable is bear and the response variable is chest size. OC. The predictor variable is bear and the response variables are weight and chest size. OD. The predictor variable is weight and the response variable is chest size. e. Identify outliers and potential influential observations.
Following are chest size and weight data for 6 randomly selected bears. Here, x denotes chest size, in inches, and y denotes weight, in pounds. Use the information to complete parts (a) through (f). 55 329 54 O 40 256 333 44 46 58 346 y 276 270 c. Describe the apparent relationship between the two variables. O A. Weight tends to increase as chest size increases. O B. Weight tends to decrease as chest size increases. O. Weight remains constant as chest size increases. OD. There is no apparent relationship between weight and chest size. d. Identify the predictor and response variables. O A. The predictor variable is chest size and the response variable is weight. OB. The predictor variable is bear and the response variable is chest size. OC. The predictor variable is bear and the response variables are weight and chest size. OD. The predictor variable is weight and the response variable is chest size. e. Identify outliers and potential influential observations.

MATLAB: An Introduction with Applications
6th Edition
ISBN:9781119256830
Author:Amos Gilat
Publisher:Amos Gilat
Chapter1: Starting With Matlab
Section: Chapter Questions
Problem 1P

Related questions
Question

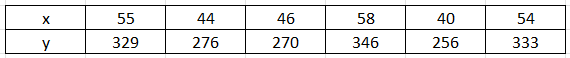
Transcribed Image Text:Following are chest size and weight data for 6 randomly selected bears. Here, x denotes chest size, in inches, and y denotes weight, in pounds. Use the information to complete parts (a) through (f).
55
329
54 O
40
256
333
44
46
58
346
y
276
270
c. Describe the apparent relationship between the two variables.
O A. Weight tends to increase as chest size increases.
O B. Weight tends to decrease as chest size increases.
O. Weight remains constant as chest size increases.
OD. There is no apparent relationship between weight and chest size.
d. Identify the predictor and response variables.
O A. The predictor variable is chest size and the response variable is weight.
OB. The predictor variable is bear and the response variable is chest size.
OC. The predictor variable is bear and the response variables are weight and chest size.
OD. The predictor variable is weight and the response variable is chest size.
e. Identify outliers and potential influential observations.
Expert Solution
Step 1
Given data set:

Step by step
Solved in 2 steps with 2 images

Recommended textbooks for you
MATLAB: An Introduction with Applications
Statistics
ISBN:
9781119256830
Author:
Amos Gilat
Publisher:
John Wiley & Sons Inc

Probability and Statistics for Engineering and th…
Statistics
ISBN:
9781305251809
Author:
Jay L. Devore
Publisher:
Cengage Learning

Statistics for The Behavioral Sciences (MindTap C…
Statistics
ISBN:
9781305504912
Author:
Frederick J Gravetter, Larry B. Wallnau
Publisher:
Cengage Learning
MATLAB: An Introduction with Applications
Statistics
ISBN:
9781119256830
Author:
Amos Gilat
Publisher:
John Wiley & Sons Inc
Probability and Statistics for Engineering and th…
Statistics
ISBN:
9781305251809
Author:
Jay L. Devore
Publisher:
Cengage Learning
Statistics for The Behavioral Sciences (MindTap C…
Statistics
ISBN:
9781305504912
Author:
Frederick J Gravetter, Larry B. Wallnau
Publisher:
Cengage Learning

Elementary Statistics: Picturing the World (7th E…
Statistics
ISBN:
9780134683416
Author:
Ron Larson, Betsy Farber
Publisher:
PEARSON

The Basic Practice of Statistics
Statistics
ISBN:
9781319042578
Author:
David S. Moore, William I. Notz, Michael A. Fligner
Publisher:
W. H. Freeman

Introduction to the Practice of Statistics
Statistics
ISBN:
9781319013387
Author:
David S. Moore, George P. McCabe, Bruce A. Craig
Publisher:
W. H. Freeman