Flow Speed (m/s) 2.0 1.0 0.8 0.6 0.4 0.2 V 0.06 0.1 A B D с E 0.5 1.0 Grain Size (mm) F Flow Depth = 0.3 m After Southard 1991 2.0 8.0
Flow Speed (m/s) 2.0 1.0 0.8 0.6 0.4 0.2 V 0.06 0.1 A B D с E 0.5 1.0 Grain Size (mm) F Flow Depth = 0.3 m After Southard 1991 2.0 8.0
Applications and Investigations in Earth Science (9th Edition)
9th Edition
ISBN:9780134746241
Author:Edward J. Tarbuck, Frederick K. Lutgens, Dennis G. Tasa
Publisher:Edward J. Tarbuck, Frederick K. Lutgens, Dennis G. Tasa
Chapter1: The Study Of Minerals
Section: Chapter Questions
Problem 1LR
Related questions
Question
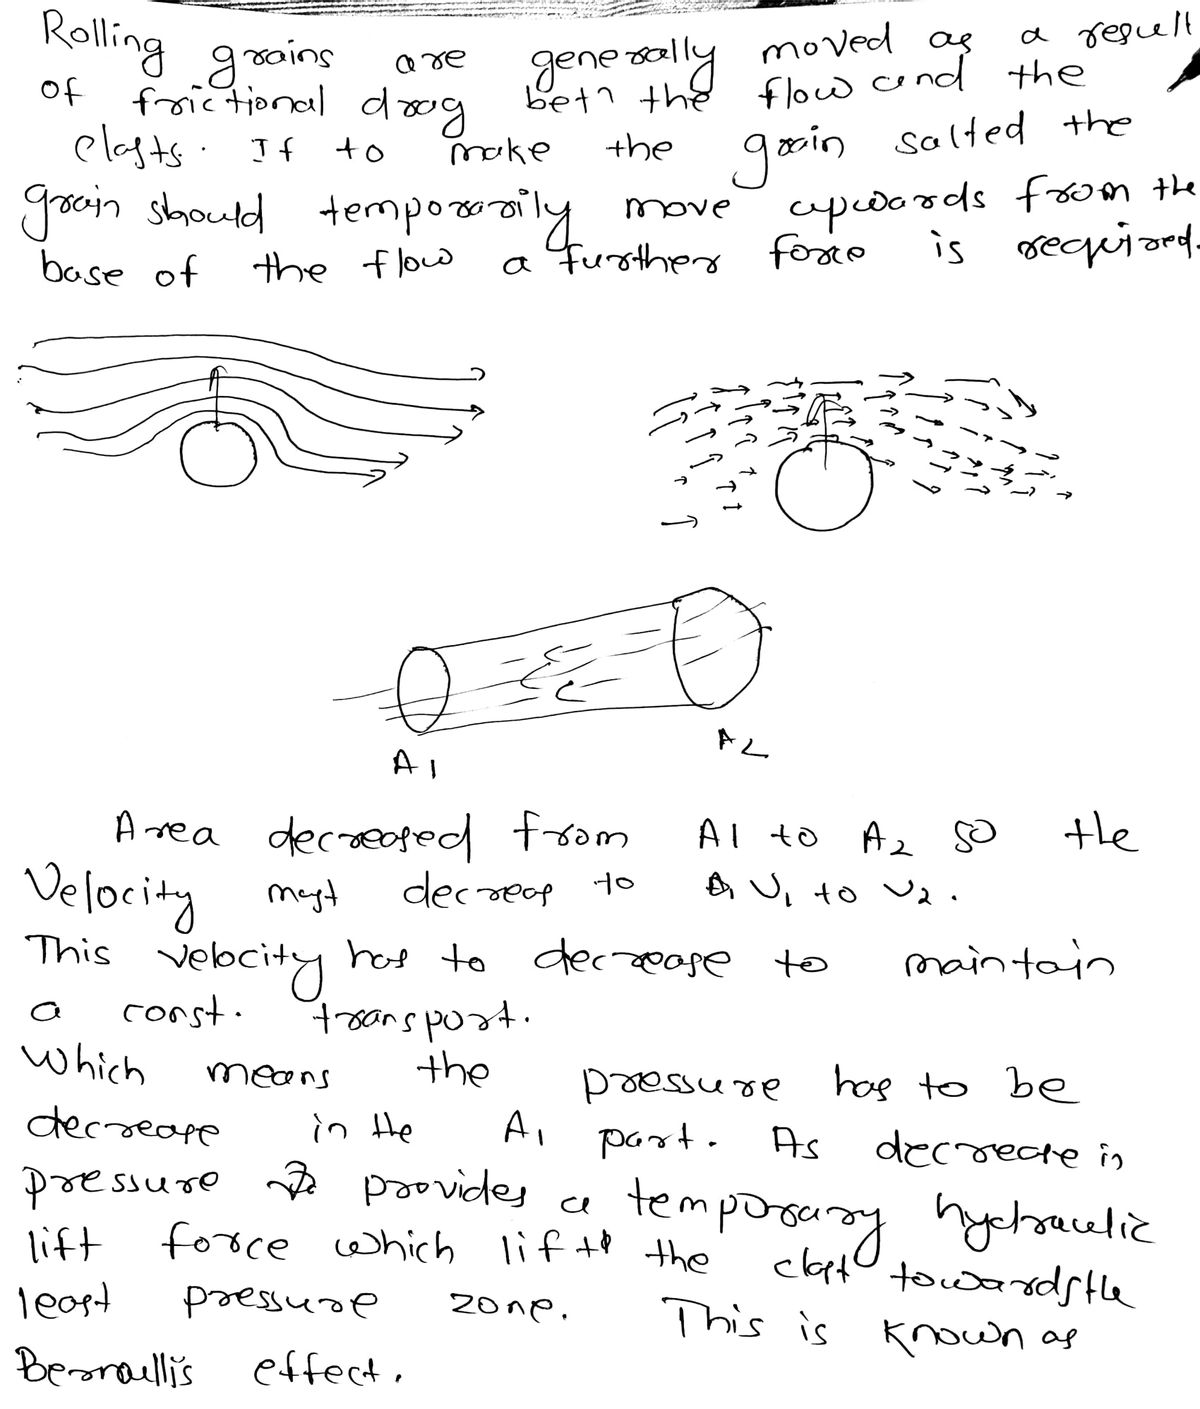
The bernoulli effect is dependent on flow speed (as this increases the pressure differential) and mass of the grain. Based on this, could you think of how grains in an upper planar regime or a lower planar regime may be differently impacted by the Bernoulli effect (hint: look at flow speed and grain size within a given regime on the chart).

Transcribed Image Text:The image is a graph depicting the relationship between flow speed (in meters per second) and sediment grain size (in millimeters). This graph is based on research by Southard from 1991 and considers a flow depth of 0.3 meters.
**Axes:**
- The x-axis represents the grain size, ranging from 0.06 mm to 8.0 mm.
- The y-axis represents the flow speed, ranging from 0.2 m/s to 2.0 m/s.
**Zones:**
The graph is divided into several labeled areas (A, B, C, D, E, F), indicating different sediment transport or depositional environments:
- **Zone A:** At the top, indicating high flow speeds across all grain sizes.
- **Zone B:** Starts around 0.06 mm grain size with a flow speed of 0.8 m/s.
- **Zone C:** Covers a range of flow speeds from around 0.6 m/s to 1.5 m/s and grain sizes from slightly above 0.1 mm to about 2.8 mm.
- **Zone D:** Below Zone B, at lower flow speeds ranging around 0.4 m/s.
- **Zone E:** A small area at a flow speed of approximately 0.4 m/s and a grain size of about 1.0 mm.
- **Zone F:** Covers larger grain sizes (around 0.6 mm to 8.0 mm) with lower flow speeds below 0.6 m/s.
**Interpretation:**
This graph is used to understand how sediment of different grain sizes is transported at varying water flow speeds. Such diagrams are crucial for sedimentologists and hydrologists in predicting sediment behavior in rivers and other sedimentary environments.
Expert Solution
Step 1 Answer

Step by step
Solved in 2 steps with 1 images

Recommended textbooks for you

Applications and Investigations in Earth Science …
Earth Science
ISBN:
9780134746241
Author:
Edward J. Tarbuck, Frederick K. Lutgens, Dennis G. Tasa
Publisher:
PEARSON

Exercises for Weather & Climate (9th Edition)
Earth Science
ISBN:
9780134041360
Author:
Greg Carbone
Publisher:
PEARSON

Environmental Science
Earth Science
ISBN:
9781260153125
Author:
William P Cunningham Prof., Mary Ann Cunningham Professor
Publisher:
McGraw-Hill Education

Applications and Investigations in Earth Science …
Earth Science
ISBN:
9780134746241
Author:
Edward J. Tarbuck, Frederick K. Lutgens, Dennis G. Tasa
Publisher:
PEARSON

Exercises for Weather & Climate (9th Edition)
Earth Science
ISBN:
9780134041360
Author:
Greg Carbone
Publisher:
PEARSON

Environmental Science
Earth Science
ISBN:
9781260153125
Author:
William P Cunningham Prof., Mary Ann Cunningham Professor
Publisher:
McGraw-Hill Education

Earth Science (15th Edition)
Earth Science
ISBN:
9780134543536
Author:
Edward J. Tarbuck, Frederick K. Lutgens, Dennis G. Tasa
Publisher:
PEARSON

Environmental Science (MindTap Course List)
Earth Science
ISBN:
9781337569613
Author:
G. Tyler Miller, Scott Spoolman
Publisher:
Cengage Learning

Physical Geology
Earth Science
ISBN:
9781259916823
Author:
Plummer, Charles C., CARLSON, Diane H., Hammersley, Lisa
Publisher:
Mcgraw-hill Education,