Floor Space (sg. ft.) 6,06e 5,230 4,280 5,580 5,670 5,e2e 5,410 4,99e 4,220 4,160 4,870 5,470 weekly sales (dollars) 16,3se 14,400 13,82e 13,820 18,230 14, 200 12,80e 15,840 16,610 13,610 1e,ese 15,320 13,270 E Click here for the Excel Data File (a) Using the table above, select the most appropriate scatter plot from the given choices. Scatter Plot A Scatter Plot B Scatter Plot C Floor Space and Weekly Sales Floor Space and Weekly Sales Floor Space and We ekly Sales 20.000 18,000 16 000 14.000 5 12,000 > 10,000 8.000 6.000 4,000 2,000 20,000 18,000 * 16.000 14.000 5 12.000 10,000 8.000 6.000 4,000 2,000 20,000 18,000 16.000 14.000 12,000 10,000 8.000 6,000 4.000 2,000 1. 1,000 2,000 3,000 4,000 5,000 6,000 7,000 1,000 2,000 3,000 4,000 5,000 6,000 7,000 1,000 2,000 3,000 4,000 5,000 6,000 7,000 FLOOR SPACE FLOOR SPACE FLOOR SPACE O Scatter Plot A O scatter Plot B O scatter Plot C (b) Define the relationship between Xand Y. (You may select more than one answer. Click the box with a check mark for the correct answer and double click to empty the box for the wrong answer.) WEKLY SALES WENLY SALES

MATLAB: An Introduction with Applications
6th Edition
ISBN:9781119256830
Author:Amos Gilat
Publisher:Amos Gilat
Chapter1: Starting With Matlab
Section: Chapter Questions
Problem 1P
icon
Related questions
Question
Floor Space (sq. ft.)
6,060
5,230
4,280
5,580
5,670
5,020
5,410
4,990
4,220
4,168
4,870
5,470
weekly Sales (dollars)
16,380
14,400
13,820
18,230
14,200
12,800
15,840
16,610
13,610
10,050
15,320
13,270
A Click here for the Excel Data File
(a) Using the table above, select the most appropriate scatter plot from the given cholces.
Scatter Plot A
Scatter Plot B
Scatter Plot C
Floor Space and We ekly Sales
Floor Space and Weekly Sales
Floor Space and We ekly Sales
20,000
18,000
16,000
14.000
12.000
10,000
8,000
6,000
4,000
2,000
20,000
18,000
16,000
14,000
12.000
10,000
8,000
6,000
4.000
2,000
20,000
18,000
16,000
14,000
12,000
10,000
8,000
6,000
4,000
2,000
1,000 2,000 3,000 4,000 5,000 6,000 7,000
1,000 2,000 3,000 4,000 5,000 6,000 7,000
1,000 2,000 3,000 4,000 5,000 6,000 7,000
FLOOR SPACE
FLOOR SPACE
FLOOR SPACE
O Scatter Plot A
O Scatter Plot B
O Scatter Plot C
(b) Define the relationship between X and Y. (You may select more than one answer. Click the box with a check mark for the correct
answer and double click to empty the box for the wrong answer.)
2 Negative
2 Strong
? Positive
? Moderate
? Nonlinear
? Linear
WEEKLY SALES
sanvSA TMEM
sayS A THEM
Transcribed Image Text:Floor Space (sq. ft.) 6,060 5,230 4,280 5,580 5,670 5,020 5,410 4,990 4,220 4,168 4,870 5,470 weekly Sales (dollars) 16,380 14,400 13,820 18,230 14,200 12,800 15,840 16,610 13,610 10,050 15,320 13,270 A Click here for the Excel Data File (a) Using the table above, select the most appropriate scatter plot from the given cholces. Scatter Plot A Scatter Plot B Scatter Plot C Floor Space and We ekly Sales Floor Space and Weekly Sales Floor Space and We ekly Sales 20,000 18,000 16,000 14.000 12.000 10,000 8,000 6,000 4,000 2,000 20,000 18,000 16,000 14,000 12.000 10,000 8,000 6,000 4.000 2,000 20,000 18,000 16,000 14,000 12,000 10,000 8,000 6,000 4,000 2,000 1,000 2,000 3,000 4,000 5,000 6,000 7,000 1,000 2,000 3,000 4,000 5,000 6,000 7,000 1,000 2,000 3,000 4,000 5,000 6,000 7,000 FLOOR SPACE FLOOR SPACE FLOOR SPACE O Scatter Plot A O Scatter Plot B O Scatter Plot C (b) Define the relationship between X and Y. (You may select more than one answer. Click the box with a check mark for the correct answer and double click to empty the box for the wrong answer.) 2 Negative 2 Strong ? Positive ? Moderate ? Nonlinear ? Linear WEEKLY SALES sanvSA TMEM sayS A THEM
Expert Solution
Step 1

Given data,

Floor space

Weekly sales

6060

16380

5230

14400

4280

13820

5580

18230

5670

14200

5020

12800

5410

15840

4990

16610

4220

13610

4160

10050

4870

15320

5470

13270


 a)

Step-by-step software procedure to draw scatter plot using Excel software is given below:

  • Enter the data in excel spreadsheet.
  • Select the data and then select Insert>Scatter>Scatter.
  • Chose X Y (Scatter) from chart.
  • Click OK.

The output using the above procedure is given below:

Statistics homework question answer, step 1, image 1

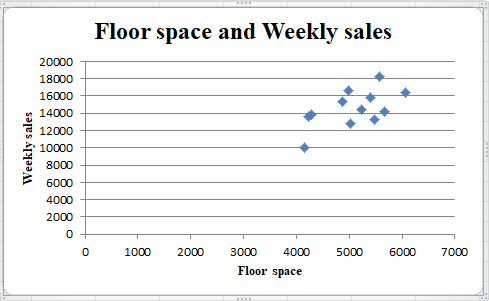
Correct option is Scatter plot A.

steps

Step by step

Solved in 2 steps with 2 images

Blurred answer
Knowledge Booster
Cylinders and Cones
Learn more about
Need a deep-dive on the concept behind this application? Look no further. Learn more about this topic, statistics and related others by exploring similar questions and additional content below.
Similar questions
Recommended textbooks for you
MATLAB: An Introduction with Applications
Statistics
ISBN:
9781119256830
Author:
Amos Gilat
Publisher:
John Wiley & Sons Inc
Probability and Statistics for Engineering and th…
Statistics
ISBN:
9781305251809
Author:
Jay L. Devore
Publisher:
Cengage Learning
Statistics for The Behavioral Sciences (MindTap C…
Statistics
ISBN:
9781305504912
Author:
Frederick J Gravetter, Larry B. Wallnau
Publisher:
Cengage Learning
Elementary Statistics: Picturing the World (7th E…
Statistics
ISBN:
9780134683416
Author:
Ron Larson, Betsy Farber
Publisher:
PEARSON
The Basic Practice of Statistics
Statistics
ISBN:
9781319042578
Author:
David S. Moore, William I. Notz, Michael A. Fligner
Publisher:
W. H. Freeman
Introduction to the Practice of Statistics
Statistics
ISBN:
9781319013387
Author:
David S. Moore, George P. McCabe, Bruce A. Craig
Publisher:
W. H. Freeman