Five observations taken for two variables follow. x 4 6 11 5 14 y 50 50 30 50 20 a. Which of the following scatter diagrams accurately represents the data set? b. What does the scatter diagram developed in part (a) indicate about the relationship between the two variables? - Select your answer -The relationship is positive.The relationship is negative. c. Compute the sample covariance (to decimal and enter negative value as negative figure).


Correlation
Correlation defines a relationship between two independent variables. It tells the degree to which variables move in relation to each other. When two sets of data are related to each other, there is a correlation between them.
Linear Correlation
A correlation is used to determine the relationships between numerical and categorical variables. In other words, it is an indicator of how things are connected to one another. The correlation analysis is the study of how variables are related.
Regression Analysis
Regression analysis is a statistical method in which it estimates the relationship between a dependent variable and one or more independent variable. In simple terms dependent variable is called as outcome variable and independent variable is called as predictors. Regression analysis is one of the methods to find the trends in data. The independent variable used in Regression analysis is named Predictor variable. It offers data of an associated dependent variable regarding a particular outcome.
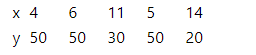
Five observations taken for two variables follow.
| x | 4 | 6 | 11 | 5 | 14 |
| y | 50 | 50 | 30 | 50 | 20 |
a. Which of the following scatter diagrams accurately represents the data set?
b. What does the
- Select your answer -The relationship is positive.The relationship is negative.
c. Compute the sample
d. Compute the sample
Interpret the sample correlation coefficient. Hint: If the correlation coefficient is greater than 0.80 or less than -0.80, there is a strong relationship.
- Select your answer -There is a strong positive linear relationship.There is a moderate positive linear relationship.There is neither a positive nor a negative linear relationship.There is a strong negative linear relationship.There is a moderate negative linear relationship.
Given Information:
Five observations taken for two variables follow
(a) Scatter plot can be constructed using Excel, steps to follow are:
- Enter the data in Excel
- Select the data, go to 'Insert'
- Under Chart types -> Select Scatter plot with markers
Output is given below:
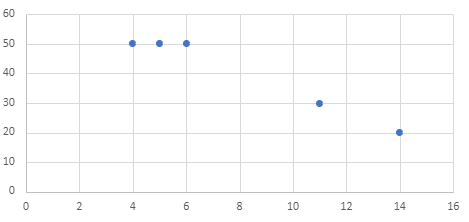
(b) The relationship between two variable is negative.
Because the scatterplot slopes downwards.

Trending now
This is a popular solution!

Step by step
Solved in 2 steps with 2 images


