States of Matter
The substance that constitutes everything in the universe is known as matter. Matter comprises atoms which in turn are composed of electrons, protons, and neutrons. Different atoms combine together to give rise to molecules that act as a foundation for all kinds of substances. There are five states of matter based on their energies of attraction, namely solid, liquid, gases, plasma, and BEC (Bose-Einstein condensates).
Chemical Reactions and Equations
When a chemical species is transformed into another chemical species it is said to have undergone a chemical reaction. It consists of breaking existing bonds and forming new bonds by changing the position of electrons. These reactions are best explained using a chemical equation.
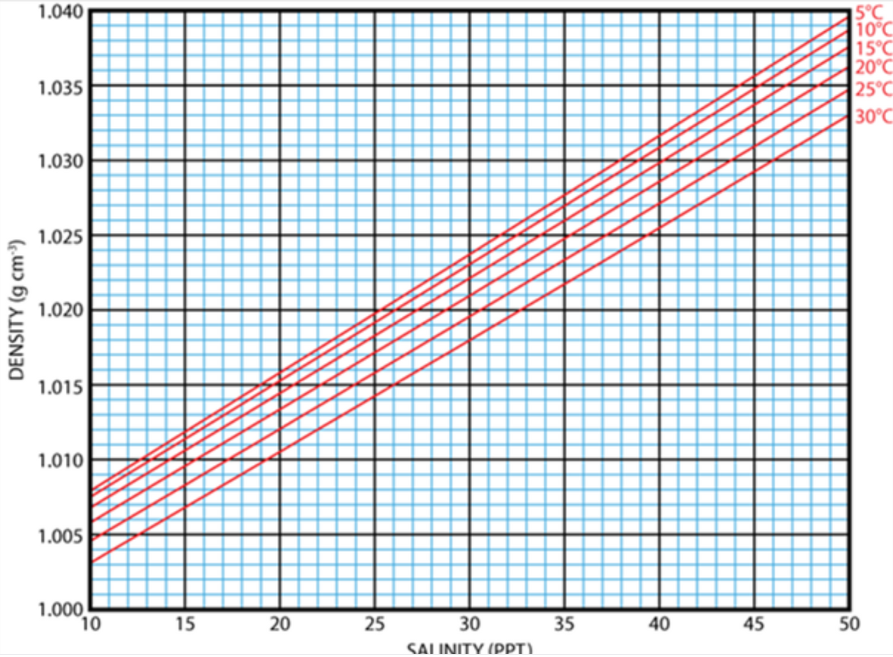
Find the Salinity based on the graph


Given that, a graph of density vs. salinity at the different temperature is shown below

We have to find the salinity of brine and melted sea ice.
Step by step
Solved in 2 steps with 2 images


