Find the value of the test statistic. (Round your answer to three decimal places.) 2.988 X Find the p-value. (Round your answer to four decimal places.) p-value = 0.0404 X What is your conclusion? Do not reject Ho. We cannot conclude that the relationship between price ($) and overall score is significant. Reject Ho. We cannot conclude that the relationship between price ($) and overall score is significant. Reject Ho. We conclude that the relationship between price ($) and overall score is significant. Do not reject Ho. We conclude that the relationship between price ($) and overall score is significant.
Find the value of the test statistic. (Round your answer to three decimal places.) 2.988 X Find the p-value. (Round your answer to four decimal places.) p-value = 0.0404 X What is your conclusion? Do not reject Ho. We cannot conclude that the relationship between price ($) and overall score is significant. Reject Ho. We cannot conclude that the relationship between price ($) and overall score is significant. Reject Ho. We conclude that the relationship between price ($) and overall score is significant. Do not reject Ho. We conclude that the relationship between price ($) and overall score is significant.
MATLAB: An Introduction with Applications
6th Edition
ISBN:9781119256830
Author:Amos Gilat
Publisher:Amos Gilat
Chapter1: Starting With Matlab
Section: Chapter Questions
Problem 1P
Related questions
Question

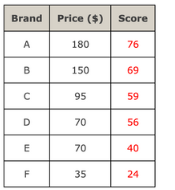
Transcribed Image Text:Consider the following data on price ($) and the overall score for six stereo headphones tested by a certain magazine. The overall score is based on sound quality and effectiveness of ambient noise reduction. Scores range from 0 (lowest) to 100 (highest).
| Brand | Price ($) | Score |
|-------|-----------|-------|
| A | 180 | 76 |
| B | 150 | 69 |
| C | 95 | 59 |
| D | 70 | 56 |
| E | 70 | 40 |
| F | 35 | 24 |
(a) The estimated regression equation for this data is \( \hat{y} = 21.926421 + 0.320736x \), where \( x \) = price ($) and \( y \) = overall score. Does the t-test indicate a significant relationship between price and the overall score? Use \( \alpha = 0.05 \).
State the null and alternative hypotheses.
- \( H_0: \beta_1 = 0 \)
- \( H_a: \beta_1 \neq 0 \)

Transcribed Image Text:**Statistical Analysis Result:**
1. **Test Statistic:**
- Value: 2.988 (Incorrect)
2. **P-value:**
- Value: 0.0404 (Incorrect)
3. **Conclusion Options:**
- Do not reject \( H_0 \): We cannot conclude that the relationship between price (\$) and overall score is significant.
- Reject \( H_0 \): We cannot conclude that the relationship between price (\$) and overall score is significant.
- **Reject \( H_0 \): We conclude that the relationship between price (\$) and overall score is significant.** (Correct choice)
- Do not reject \( H_0 \): We conclude that the relationship between price (\$) and overall score is significant.
**Graph/Diagram Explanation:**
The image provides an interface for testing hypotheses about the relationship between price and overall score. The options indicate a decision-making process based on statistical values, with the correct conclusion highlighted.
Expert Solution
Step 1
Given :

Step by step
Solved in 3 steps with 6 images

Recommended textbooks for you

MATLAB: An Introduction with Applications
Statistics
ISBN:
9781119256830
Author:
Amos Gilat
Publisher:
John Wiley & Sons Inc

Probability and Statistics for Engineering and th…
Statistics
ISBN:
9781305251809
Author:
Jay L. Devore
Publisher:
Cengage Learning

Statistics for The Behavioral Sciences (MindTap C…
Statistics
ISBN:
9781305504912
Author:
Frederick J Gravetter, Larry B. Wallnau
Publisher:
Cengage Learning

MATLAB: An Introduction with Applications
Statistics
ISBN:
9781119256830
Author:
Amos Gilat
Publisher:
John Wiley & Sons Inc

Probability and Statistics for Engineering and th…
Statistics
ISBN:
9781305251809
Author:
Jay L. Devore
Publisher:
Cengage Learning

Statistics for The Behavioral Sciences (MindTap C…
Statistics
ISBN:
9781305504912
Author:
Frederick J Gravetter, Larry B. Wallnau
Publisher:
Cengage Learning

Elementary Statistics: Picturing the World (7th E…
Statistics
ISBN:
9780134683416
Author:
Ron Larson, Betsy Farber
Publisher:
PEARSON

The Basic Practice of Statistics
Statistics
ISBN:
9781319042578
Author:
David S. Moore, William I. Notz, Michael A. Fligner
Publisher:
W. H. Freeman

Introduction to the Practice of Statistics
Statistics
ISBN:
9781319013387
Author:
David S. Moore, George P. McCabe, Bruce A. Craig
Publisher:
W. H. Freeman