Find the value of the test statistic for class. (Round your answer to two decimal places.) Find the p-value for class. (Round your answer to three decimal places.) p-value = State your conclusion about class. O Because the p-value > a = 0.05, class is significant. O Because the p-value ≤ α = 0.05, class is not significant. O Because the p-value ≤ α = 0.05, class is significant. O Because the p-value > a = 0.05, class is not significant. Find the value of the test statistic for type. (Round your answer to two decimal places.) Find the p-value for type. (Round your answer to three decimal places.) p-value = State your conclusion about type. O Because the p-value > a = 0.05, type is significant. O Because the p-value ≤ α = 0.05, type is significant. O Because the p-value ≤ α = 0.05, type is not significant. O Because the p-value > a = 0.05, type is not significant. Find the value of the test statistic for interaction between class and type. (Round your answer to two decimal places.) Find the p-value for interaction between class and type. (Round your answer to three decimal places.) p-value =
Find the value of the test statistic for class. (Round your answer to two decimal places.) Find the p-value for class. (Round your answer to three decimal places.) p-value = State your conclusion about class. O Because the p-value > a = 0.05, class is significant. O Because the p-value ≤ α = 0.05, class is not significant. O Because the p-value ≤ α = 0.05, class is significant. O Because the p-value > a = 0.05, class is not significant. Find the value of the test statistic for type. (Round your answer to two decimal places.) Find the p-value for type. (Round your answer to three decimal places.) p-value = State your conclusion about type. O Because the p-value > a = 0.05, type is significant. O Because the p-value ≤ α = 0.05, type is significant. O Because the p-value ≤ α = 0.05, type is not significant. O Because the p-value > a = 0.05, type is not significant. Find the value of the test statistic for interaction between class and type. (Round your answer to two decimal places.) Find the p-value for interaction between class and type. (Round your answer to three decimal places.) p-value =

MATLAB: An Introduction with Applications
6th Edition
ISBN:9781119256830
Author:Amos Gilat
Publisher:Amos Gilat
Chapter1: Starting With Matlab
Section: Chapter Questions
Problem 1P

Related questions
Question
100%
Problems Until test statistic for type
![**Analyzing Statistical Significance for Class and Type**
1. **Find the value of the test statistic for class.**
- (Round your answer to two decimal places.)
- [Input box for the test statistic]
2. **Find the p-value for class.**
- (Round your answer to three decimal places.)
- p-value = [Input box for p-value]
3. **State your conclusion about class.**
- Options:
- Because the p-value > α = 0.05, class is significant.
- Because the p-value ≤ α = 0.05, class is not significant.
- Because the p-value ≤ α = 0.05, class is significant.
- Because the p-value > α = 0.05, class is not significant.
4. **Find the value of the test statistic for type.**
- (Round your answer to two decimal places.)
- [Input box for the test statistic]
5. **Find the p-value for type.**
- (Round your answer to three decimal places.)
- p-value = [Input box for p-value]
6. **State your conclusion about type.**
- Options:
- Because the p-value > α = 0.05, type is significant.
- Because the p-value ≤ α = 0.05, type is significant.
- Because the p-value ≤ α = 0.05, type is not significant.
- Because the p-value > α = 0.05, type is not significant.
7. **Find the value of the test statistic for interaction between class and type.**
- (Round your answer to two decimal places.)
- [Input box for the test statistic]
8. **Find the p-value for interaction between class and type.**
- (Round your answer to three decimal places.)
- p-value = [Input box for p-value]](/v2/_next/image?url=https%3A%2F%2Fcontent.bartleby.com%2Fqna-images%2Fquestion%2F8ad87420-52d2-4e34-815e-eb9bcb5c95c0%2Fd1db92f7-ab9e-4f51-af6e-5703d336087c%2F803ivj_processed.png&w=3840&q=75)
Transcribed Image Text:**Analyzing Statistical Significance for Class and Type**
1. **Find the value of the test statistic for class.**
- (Round your answer to two decimal places.)
- [Input box for the test statistic]
2. **Find the p-value for class.**
- (Round your answer to three decimal places.)
- p-value = [Input box for p-value]
3. **State your conclusion about class.**
- Options:
- Because the p-value > α = 0.05, class is significant.
- Because the p-value ≤ α = 0.05, class is not significant.
- Because the p-value ≤ α = 0.05, class is significant.
- Because the p-value > α = 0.05, class is not significant.
4. **Find the value of the test statistic for type.**
- (Round your answer to two decimal places.)
- [Input box for the test statistic]
5. **Find the p-value for type.**
- (Round your answer to three decimal places.)
- p-value = [Input box for p-value]
6. **State your conclusion about type.**
- Options:
- Because the p-value > α = 0.05, type is significant.
- Because the p-value ≤ α = 0.05, type is significant.
- Because the p-value ≤ α = 0.05, type is not significant.
- Because the p-value > α = 0.05, type is not significant.
7. **Find the value of the test statistic for interaction between class and type.**
- (Round your answer to two decimal places.)
- [Input box for the test statistic]
8. **Find the p-value for interaction between class and type.**
- (Round your answer to three decimal places.)
- p-value = [Input box for p-value]

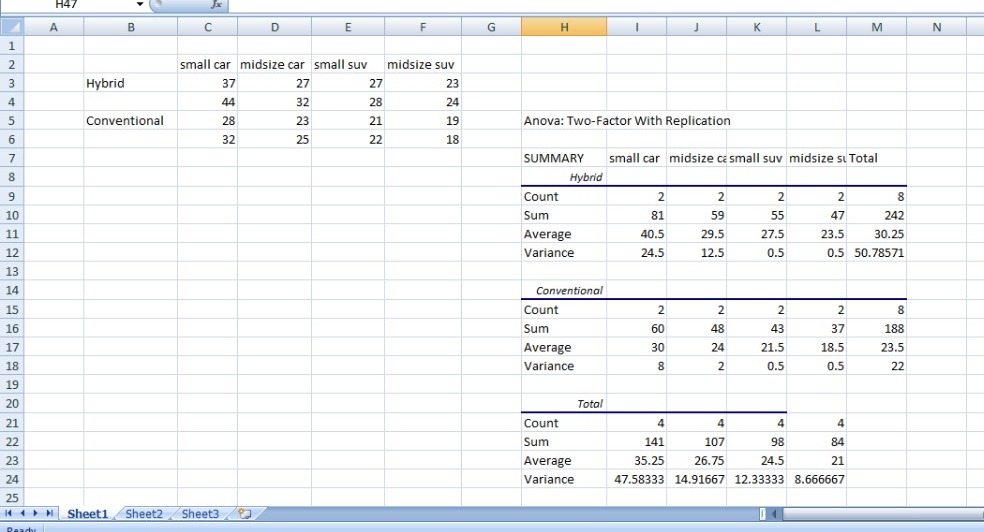
Transcribed Image Text:As part of a study designed to compare hybrid and similarly equipped conventional vehicles, a group tested a variety of classes of hybrid and all-gas model cars and sport utility vehicles (SUVs). The following data show the miles-per-gallon (MPG) rating obtained for two hybrid small cars, two hybrid midsize cars, two hybrid small SUVs, and two hybrid midsize SUVs. Additionally, MPG ratings for eight similarly equipped conventional models are provided.
### Data Table
| Class | Type | MPG |
|---------------|---------------|-----|
| Small Car | Hybrid | 37 |
| Small Car | Conventional | 28 |
| Small Car | Hybrid | 44 |
| Small Car | Conventional | 32 |
| Midsize Car | Hybrid | 27 |
| Midsize Car | Conventional | 23 |
| Midsize Car | Hybrid | 32 |
| Midsize Car | Conventional | 25 |
| Small SUV | Hybrid | 27 |
| Small SUV | Conventional | 21 |
| Small SUV | Hybrid | 28 |
| Small SUV | Conventional | 22 |
| Midsize SUV | Hybrid | 23 |
| Midsize SUV | Conventional | 19 |
| Midsize SUV | Hybrid | 24 |
| Midsize SUV | Conventional | 18 |
At the α = 0.05 level of significance, test for significant effects due to class, type, and interaction.
Expert Solution
Step 1

Step by step
Solved in 2 steps with 2 images

Recommended textbooks for you
MATLAB: An Introduction with Applications
Statistics
ISBN:
9781119256830
Author:
Amos Gilat
Publisher:
John Wiley & Sons Inc

Probability and Statistics for Engineering and th…
Statistics
ISBN:
9781305251809
Author:
Jay L. Devore
Publisher:
Cengage Learning

Statistics for The Behavioral Sciences (MindTap C…
Statistics
ISBN:
9781305504912
Author:
Frederick J Gravetter, Larry B. Wallnau
Publisher:
Cengage Learning
MATLAB: An Introduction with Applications
Statistics
ISBN:
9781119256830
Author:
Amos Gilat
Publisher:
John Wiley & Sons Inc
Probability and Statistics for Engineering and th…
Statistics
ISBN:
9781305251809
Author:
Jay L. Devore
Publisher:
Cengage Learning
Statistics for The Behavioral Sciences (MindTap C…
Statistics
ISBN:
9781305504912
Author:
Frederick J Gravetter, Larry B. Wallnau
Publisher:
Cengage Learning

Elementary Statistics: Picturing the World (7th E…
Statistics
ISBN:
9780134683416
Author:
Ron Larson, Betsy Farber
Publisher:
PEARSON

The Basic Practice of Statistics
Statistics
ISBN:
9781319042578
Author:
David S. Moore, William I. Notz, Michael A. Fligner
Publisher:
W. H. Freeman

Introduction to the Practice of Statistics
Statistics
ISBN:
9781319013387
Author:
David S. Moore, George P. McCabe, Bruce A. Craig
Publisher:
W. H. Freeman