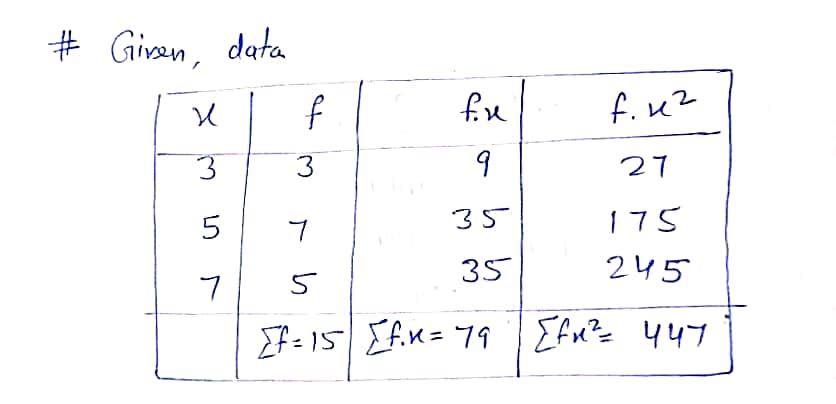
- Find the standard deviation. Si f 3 3 5 7 7 5 a) 1.49 B) 5.77 NS) 2.21 D) 4.88 TO) 1.94
Q: Claim: The standard deviation of pulse rates of adult males is less than 10 bpm. For a random…
A: Given Pulse rate of adult male is less than 10
Q: Explain the difference between aand aand between and The quantity is the sample mean of all the…
A: We have to explain the difference between σ and σx¯ and between μ and μx¯.
Q: Claim: The mean pulse rate (in beats per minute) of adult males is equal to 69.1 bpm. For a random…
A: We have to find claim and hypothesis for given data....
Q: Find the (a) mean, (b) median, (c) mode, and (d) midrange for the data and then (e) answer the given…
A: Given For 16) n=11 For 17) Z=-1.73
Q: Claim: The mean pulse rate (in beats per minute) of adult males is equal to 69 bpm. For a random…
A: Given information,The mean pulse rate of adult males is equal to 69bpm. For a random sample of 139…
Q: a set of n values x1, x2.. X n has (3 standard deviation 6, the standard deviation :of n values x1…
A: This question is related to statistics.
Q: Assume that adults have IQ scores that are normally distributed with mean of u = 105 and a standard…
A: Here IQ scores follow N(105,20). We need to find P(85<X<125).
Q: Consider the list L1 = {1, 3, 4, 5, 7}. The standard deviation of L1 is 2. If we add 5 to each…
A: ( 3 ) Standard deviation = ? ( 4 ) The area under any histogram is --- %
Q: A large pizzeria makes 1000 pies per day. The mean diameter of u=10.1 inches and the standard…
A: Hello! As you have posted more than 3 sub parts, we are answering the first 3 sub-parts. In case…
Q: In one section of STAT 1811 course, there are 10 girls and 20 boys. What Is the probablllty that In…
A: From the provided information, There are 10 girls and 20 boys in one section of STAT 1811 course.…
Q: Claim: The mean pulse rate (in beats per minute) of adult males is equal to 69.1 bpm. For a random…
A: Claims in statistic is tested using the hypothesis testing. In the hypothesis test of mean, the null…
Q: Claim: The mean pulse rate (in beats per minute) of adult males is equal to 69.1 bpm. For a random…
A: Solution: a. The given claim is that mean pulse rate of adult males is equal to 69.1.
Q: 1 2 3 4 5 6 7 8 X(x.) - N= The x₁ 7.2 7.3 7.2 7.1 7.1 7.2 7.1 7.2 (x₁ - x) Σ(x,-x, N rel. 0₂ D (x₁ -…
A: The mean and standard deviation of the data set can be computed as follows: Mean:Symbolic formula:…
Q: Claim: The mean pulse rate (in beats per minute) of adult males is equal to 69 bpm. For a random…
A: given data n = 142x¯ =70.4s = 10.6claim : μ =69
Q: Claim: The standard deviation of pulse rates of adult males is more than 10 bpm. For a random sample…
A: The given claim is that the standard deviation of pulse rates of adult males is more than 10 bpm.
Q: Illustration 11.27. In a certain distribution the first four mo- ments about the arbitrary origin…
A:
Q: ٢.The following table shows the observed frequencies in a goodness of fit test: Methods First Second…
A: We want to find chi square value
Q: A sample is selected from a population with µ = 80 and a treatment is administered to the sample.…
A:
Q: Claim: The mean pulse rate (in beats per minute) of adult males is equal to 69.5 bpm. For a random…
A: Solution-: Given: μ0=69.5,σ=10.6,x¯=69.7,n=138 We want to find, (a) Express the original claim in…
Q: Claim: The mean pulse rate (in beats per minute) of adult males is equal to 68.7 bpm. For a random…
A:
Q: Given Z(-)- 78 and N= 80, then the population standard deviation, a, is approximately O al 0.975 Ob)…
A:
Q: Given the population of data for the ages for all Math Instructors at MPC: 38 56 75 63 49…
A:
Q: Claim: The mean pulse rate (in beats per minute) of adult males is equal to 69.2 bpm. For a random…
A:
Q: Claim: Amajority of adults would erase all of their personal information online if they could.…
A: The original claim is that majority of adults would erase all of their personal information online…
Q: The mean pulse rate (in beats per minute) of adult males is equa rd deviation is 10.9 bpm. Complete…
A: The claim is that the mean pulse rate is equal to 69.1
Q: Claim: The mean pulse rate (in beats per minute) of adult males is equal to 68.8 bpm. For a random…
A: Consider that µ is the mean pulse rate of adult males.
Q: K Claim: The mean pulse rate (in beats per minute) of adult males is equal to 69.1 bpm. For a random…
A: According to the given information in this question We need to identify the hypothesis
Q: Assume that thermometer readings are normally distributed with a mean of 0°C and a standard…
A: given data normal distribution μ= 0σ= 1 so it is standard normal distribution P(0.75<x<2.25)…
Q: Claim: The mean pulse rate (in beats per minute) of adult males is equal to 69.1 bpm. For a random…
A: Statistical hypothesis testing is an important method in inferential statistics. It is used to test…
Q: Claim: The mean pulse rate (in beats per minute) of adult males is equal to 69.2 bpm. For a random…
A: Solution: Given information: n= 158 Sample size x= 68.4 bpm Sample mean μ=69.2 bpm Population mean…
Q: 17A population has mean u 7 and standard deviation o = 2. %3D a Find the z-score for a population…
A: Givenmean(μ)=7standard deviation(σ)=2
Q: ciaim The standard deviation of pulse rates of adult males is less than 11 tom For a rando sample of…
A:
Q: Examine the image below and then answer all parts of the question under it. Enter your answers as…
A: a) There are 4 yellow objects in 10 objects.So, P(yellow)=410=0.4b) There are 3 hearts in the 10…
Q: laim: The standard deviation of pulse rates of adult males is more than 1 1.9 bpm. Complete parts…
A: The null hypothesis can be defined as a hypothesis of no difference or equality while the…
Q: Claim: The mean pulse rate (in beats per minute) of adult males is equal to 69 bpm. For a random…
A: Given Claim : The mean pulse rate (in beats per minute) of adult males is equal to 69 bpm.…
Q: 0 1 2 3 Xj РX - х) 0.20 0.30 0.40 0.10 What is the standard deviation of X? 0.840 0.090 1.345 0.917
A: Obtain the value of the standard deviation. The value of the standard deviation is obtained below:…
Q: v 40. For a group containing 100 observations, the arithmetic mean and standard mean and the…
A:
Q: Tall the frequency, a fair die (6-sided) by rolling 25 times First try Second try Face on Die…
A: The experiment ask to fill the frequency table for three trials and in each trial the die should be…
Q: Claim: The standard deviation of pulse rates of adult males is less than 11 bpm. For a random sample…
A: Solution: From the given information, the claim is that the standard deviation of pulse rates of…
Q: Use the following information to answer problems 13 and 14. Cholesterol levels among 14-year-old…
A:
Q: The numbers of orders placed online with Jaysmart Electronics for the last 12 months were: 1145 1091…
A: From the provided information, Sample size (n) = 12
Q: he number of students that took this c
A: The histogram is given with prealgebra exam scores and frequency in the class.
Q: You measure 40 textbooks' weights, and find they have a mean weight of 59 ounce standard deviation…
A:
Q: Claim: The standard deviation of pulse rates of adult males less than 11 bpm. For a random sample of…
A: We have to find cliam.. For given data
Q: Measured value for n=20 identical specimen with a known recorded value of 2 are: 1.8, 2.2, 2.1, 2.3,…
A: Given data: 1.8 2.2 2.1 2.3 2.1 2.2 2.1 2.1 1.8 1.9 2.4 2.0 1.9 1.9…
Q: Claim: The mean pulse rate (in beats per minute) of adult males is equal to 68.9 bpm. For a random…
A: The claim is that the mean pulse rate of adult males is equal to 68.9 bpm.
37 - |
Find the standard deviation. Si f 3 3 5 7 7 5
|
|
Step by step
Solved in 2 steps with 2 images
- The heights (in inches) of 10adult males in an office are listed below. a. Find the standard deviation. Show the table (two columns) with all entries and the formula with appropriate entries. E(x-x)² S = 70 72 71 70 69 73 69 68 70 60 n-1this Claim: The standard deviation of pulse rates of adult males is more than 10 bpm. For a random sample of 158 adult males, the pulse rates have a standard deviation of 10.9 bpm. Complete parts (a) and (b) below. a. Express the original claim in symbolic form. bpm (Type an integer or a decimal. Do not round.) View an example Get more help. 7 5 2014 E с R F G V JULE MacBook Air B H N J *** M K H L command Clear all alt option Check answerK The IQ scores for a random sample of subjects with low lead levels in their blood and another random sample of subjects with high lead levels in their blood were collected. The statistics are summarized in the accompanying table. Assume that the two samples are independent simple random samples selected from normally distributed populations. Do not assume that the population standard deviations are equal. Complete parts (a) to (c) below. tcrunch @ W S OA. Ho: H₁ H2 H₁: H1 H2 = OC. Ho: P1 P2 H₁: H1 H₂ The test statistic is a. Use a 0.05 significance level to test the claim that the mean IQ score of people with low blood lead levels is higher than the mean IQ score of people with high blood lead levels. What are the null and alternative hypotheses? Assume that population 1 consists of subjects with low lead levels and population 2 consists of subjects with high lead levels. The P-value is State the conclusion for the test. Tech help ZO F3 (Round to two decimal places as needed.) (Round…
- A popular theory is that presidential candidates have an advantage if they are taller than their main opponents. Listed are heights (in centimeters) of randomly selected presidents along with the heights of their main opponents. Complete parts (a) and (b) below. Height (cm) of President 185 170 179 191 194 179 9 Height (cm) of Main Opponent 170 184 174 166 194 182 Identify the test statistic. t= 0.57 (Round to two decimal places as needed.) Identify the P-value P-value = 0.286 (Round to three decimal places as needed.) What is the conclusion based on the hypothesis test? Since the P-value is greater than the significance level, fail to reject the null hypothesis. There is not sufficient evidence to support the claim that presidents tend to be taller than their opponents. b. Construct the confidence interval that could be used for the hypothesis test described in part (a). What feature of the confidence interval leads to the same conclusion reached in part (a)? The confidence interval…A study of seat belt users and nonusers yielded the randomly selected sample data summarized in the accompanying table. Use a 0.05 significance level to test the claim that the amount of smoking is independent of seat belt use. A plausible theory is that people who smoke are less concerned about their health and safety and are therefore less inclined to wear seat belts. Is this theory supported by the sample data? E Click the icon to view the data table. Determine the test statistic. *= (Round to three decimal places as needed.) Determine the P-value of the test statistic. P-Value (Round to three decimal places as needed.) Use a 0.05 significance level to test the claim that the amount of smoking is independent of seat belt use. A plausible theory is that people who smoke are less concerned about their health and safety and are therefore less inclined to wear seat belts. Is this theory supported by the sample data?How many students took the test?
- K Assume that females have pulse rates that are normally distributed with a mean of μ = 76.0 beats per minute and a standard deviation of o= 12.5 beats per minute. Complete parts (a) through (c) below. a. If 1 adult female is randomly selected, find the probability that her pulse rate is less than 79 beats per minute. The probability is (Round to four decimal places as needed.) b. If 16 adult females are randomly selected, find the probability that they have pulse rates with a mean less than 79 beats per minute. The probability is (Round to four decimal places as needed.) c. Why can the normal distribution be used in part (b), even though the sample size does not exceed 30? OA. Since the original population has a normal distribution, the distribution of sample means is a normal distribution for any sample size. OB. Since the distribution is of individuals, not sample means, the distribution is a normal distribution for any sample size. OC. Since the distribution is of sample means, not…Claim: The mean pulse rate (in beats per minute) of adult males is equal to 68.8 bpm. For a random sample of 144 adult males, the mean pulse rate is 69.1 bpm and the standard deviation is 10.8 bpm. Complete parts (a) and (b) below. a. Express the original claim in symbolic form. bpm (Type an integer or a decimal. Do not round.)3) During a study, the weights of test subjects was recorded. The results are displayed in the graph below. Use the graph to determine the value of the following descriptive statistics Histogram of Wt (n=40) 20 15 10 10 100 150 X Values D How many weights were recorded? D) What is the average weight? O Approximate the standard deviation. d) What is the one-standard deviation interval around the mean? How many weights were within this interval? I What percentage of weights were within this interval? What is the two standard deviation interval around the mean? hi How many weights werE within this interval? What percentage of we were within thisterva What is the three standard deviation ntervalarund the mean K) How many weights were within this interv What percentage of weights were withiin thikinterval? 梦 $ hp
- K Assume that females have pulse rates that are normally distributed with a mean of μ = 76.0 beats per minute and a standard deviation of o= 12.5 beats per minute. Complete parts (a) through (c) below. a. If 1 adult female is randomly selected, find the probability that her pulse rate is less than 82 beats per minute. The probability is (Round to four decimal places as needed.) b. If 4 adult females are randomly selected, find the probability that they have pulse rates with a mean less than 82 beats per minute. The probability is (Round to four decimal places as needed.) c. Why can the normal distribution be used in part (b), even though the sample size does not exceed 30? OA. Since the original population has a normal distribution, the distribution of sample means is a normal distribution for any sample size. OB. Since the mean pulse rate exceeds 30, the distribution of sample means is a normal distribution for any sample size. C. Since the distribution is of individuals, not sample…NAME: DATE: COURSE: SCORE: ACTIVITY: A. Find the range and the standard deviation. 5, 8, 16, 17, 18, 2O B. Solve for the Standard Deviation A cons umer group has tested a sampl e of 8 size-D batteries from each 3 companies. The results of the test are sho wn in the following table. According to these tests, which of the company produces batteries for which the values repres enting hours of constant use have the smallest standard deviation? HOUR S OF CONS TANT USE P ER BATT ERY COM PANY EVERS OBRIGHT 6.2, 6.4, 7.1, 5.9, 8.3, 5.3, 7.5, 9.3 DEPEN DABLE 6.8, 6.2, 7.2, 5.9, 7.0, 7.4, 7.3, 8.2 6.1, 6.6, 7.3, 5.7, 7.1,7.6, 7.1, 8.5 BEACONFind the standard deviation for the given data. The data represents the age (in years) at which 10 individuals first traveled by plane. Round your answer to one more decimal place than the original data.15, 42, 53, 7, 9, 12, 14, 28, 47A) 29.1 years B) 16.6 years C) 17.8 years D) 15.8 years