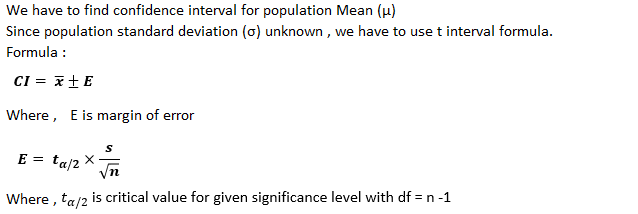
Find the necessary confidence interval for a population mean u for the following values. (Round your answers to two decimal places.) a = 0.05, n = 85, x = 66.6, s² = 2.38 to Interpret the interval that you have constructed. There is a 5% chance that an individual sample mean will fall within the interval. In repeated sampling, 5% of all intervals constructed in this manner will enclose the population mean. 95% of all values will fall within the interval. There is a 95% chance that an individual sample mean will fall within the interval. O In repeated sampling, 95% of all intervals constructed in this manner will enclose the population mean.
Find the necessary confidence interval for a population mean u for the following values. (Round your answers to two decimal places.) a = 0.05, n = 85, x = 66.6, s² = 2.38 to Interpret the interval that you have constructed. There is a 5% chance that an individual sample mean will fall within the interval. In repeated sampling, 5% of all intervals constructed in this manner will enclose the population mean. 95% of all values will fall within the interval. There is a 95% chance that an individual sample mean will fall within the interval. O In repeated sampling, 95% of all intervals constructed in this manner will enclose the population mean.

MATLAB: An Introduction with Applications
6th Edition
ISBN:9781119256830
Author:Amos Gilat
Publisher:Amos Gilat
Chapter1: Starting With Matlab
Section: Chapter Questions
Problem 1P

Related questions
Question
100%
18

Transcribed Image Text:**Finding the Confidence Interval for a Population Mean**
In this example, we are tasked with finding the confidence interval for a population mean \( \mu \) using the given values and to interpret the interval accurately. The specific values provided are:
- Significance level (\( \alpha \)): 0.05
- Sample size (\( n \)): 85
- Sample mean (\( \bar{x} \)): 66.6
- Sample variance (\( s^2 \)): 2.38
**Steps:**
1. **Calculate the Confidence Interval:**
- Determine the confidence level, which is \( 1 - \alpha = 0.95 \) or 95%.
- Use the given sample size, mean, and variance to find the confidence interval bounds.
- Round your answers to two decimal places.
2. **Interpret the Interval:**
The correct interpretation of the constructed confidence interval should be chosen from the following options:
- There is a 5% chance that an individual sample mean will fall within the interval.
- In repeated sampling, 5% of all intervals constructed in this manner will enclose the population mean.
- 95% of all values will fall within the interval.
- There is a 95% chance that an individual sample mean will fall within the interval.
- In repeated sampling, 95% of all intervals constructed in this manner will enclose the population mean.
**Explanation:**
Confidence intervals provide a range within which we expect the true population parameter to lie. It is a reflection of statistical confidence based on sample data, without guaranteeing the parameter's location within that range for a single interval but rather across many different samples and intervals.
Expert Solution
Step 1

Step by step
Solved in 2 steps with 4 images

Recommended textbooks for you
MATLAB: An Introduction with Applications
Statistics
ISBN:
9781119256830
Author:
Amos Gilat
Publisher:
John Wiley & Sons Inc

Probability and Statistics for Engineering and th…
Statistics
ISBN:
9781305251809
Author:
Jay L. Devore
Publisher:
Cengage Learning

Statistics for The Behavioral Sciences (MindTap C…
Statistics
ISBN:
9781305504912
Author:
Frederick J Gravetter, Larry B. Wallnau
Publisher:
Cengage Learning
MATLAB: An Introduction with Applications
Statistics
ISBN:
9781119256830
Author:
Amos Gilat
Publisher:
John Wiley & Sons Inc
Probability and Statistics for Engineering and th…
Statistics
ISBN:
9781305251809
Author:
Jay L. Devore
Publisher:
Cengage Learning
Statistics for The Behavioral Sciences (MindTap C…
Statistics
ISBN:
9781305504912
Author:
Frederick J Gravetter, Larry B. Wallnau
Publisher:
Cengage Learning

Elementary Statistics: Picturing the World (7th E…
Statistics
ISBN:
9780134683416
Author:
Ron Larson, Betsy Farber
Publisher:
PEARSON

The Basic Practice of Statistics
Statistics
ISBN:
9781319042578
Author:
David S. Moore, William I. Notz, Michael A. Fligner
Publisher:
W. H. Freeman

Introduction to the Practice of Statistics
Statistics
ISBN:
9781319013387
Author:
David S. Moore, George P. McCabe, Bruce A. Craig
Publisher:
W. H. Freeman