Find the mean for the data items in the given frequency distribution. 3 6 1 9 Score, x Frequency, f . 1 1 2 2 4 6 5 5 ... 75 com 8 3 9 3 10 3
Find the mean for the data items in the given frequency distribution. 3 6 1 9 Score, x Frequency, f . 1 1 2 2 4 6 5 5 ... 75 com 8 3 9 3 10 3

MATLAB: An Introduction with Applications
6th Edition
ISBN:9781119256830
Author:Amos Gilat
Publisher:Amos Gilat
Chapter1: Starting With Matlab
Section: Chapter Questions
Problem 1P

Related questions
Question
21: Answer
![**Educational Website Text**
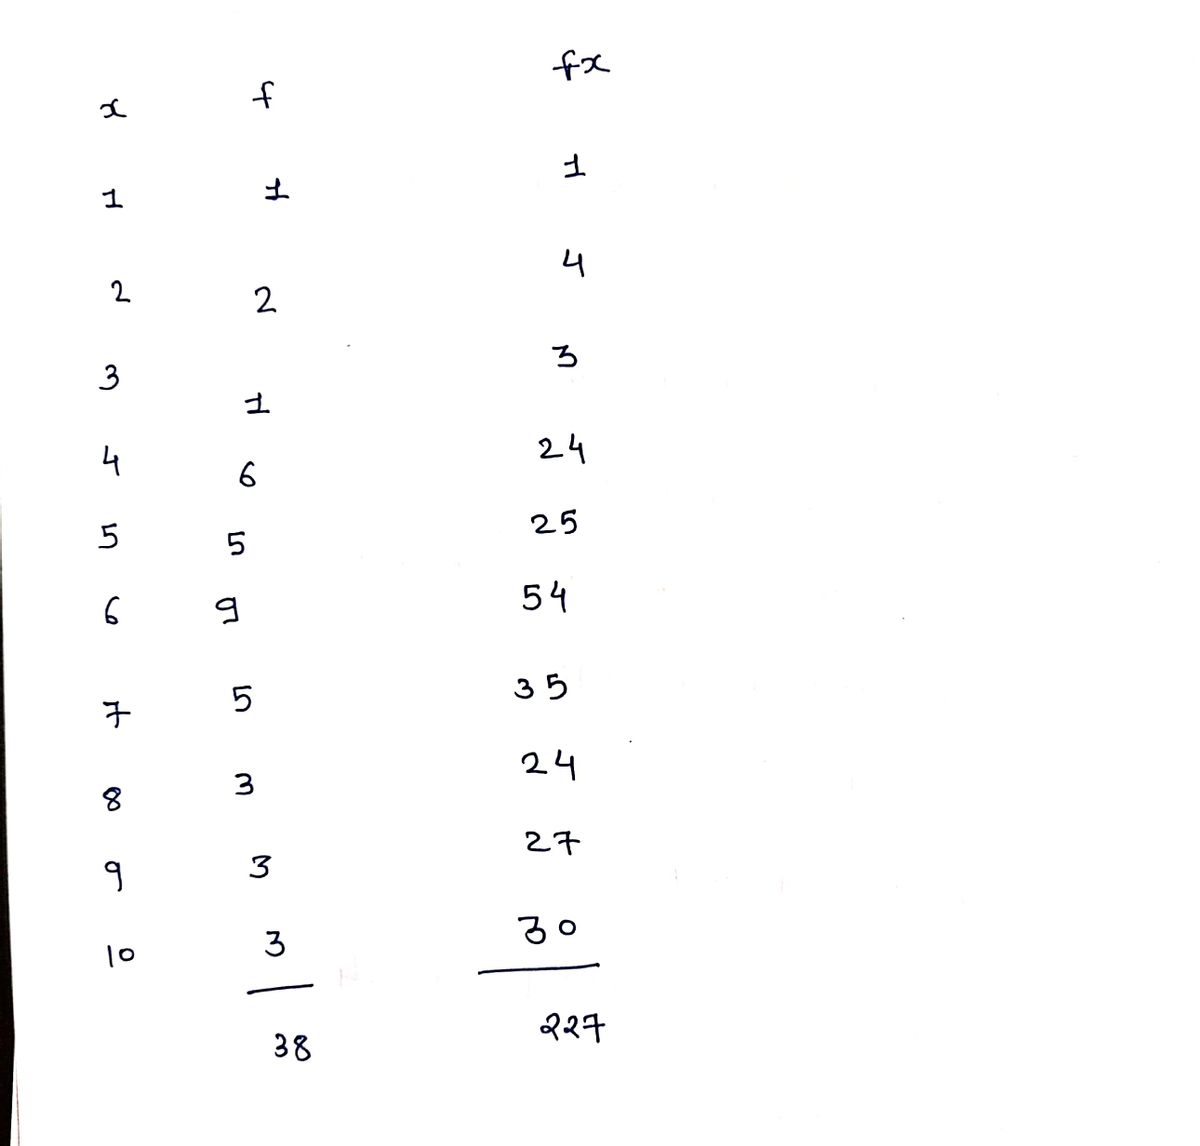
**Finding the Mean for Data in a Frequency Distribution**
To find the mean for data items in a given frequency distribution, follow these steps:
**Table of Scores and Frequencies:**
| Score (x) | 1 | 2 | 3 | 4 | 5 | 6 | 7 | 8 | 9 | 10 |
|--------------|---|---|---|---|---|---|---|---|---|----|
| Frequency (f)| 1 | 2 | 1 | 6 | 5 | 9 | 5 | 3 | 3 | 3 |
**Calculating the Mean:**
1. **Multiply each score (x) by its corresponding frequency (f).**
- Example: x = 1, f = 1, so 1 * 1 = 1
- Continue this for all scores.
2. **Sum up all the products obtained in step 1.**
3. **Sum up all the frequencies (f).**
4. **Divide the sum of the products by the sum of the frequencies:**
\[
\text{Mean} = \frac{\sum (x \times f)}{\sum f}
\]
5. **Round the result to three decimal places as needed.**
**Example Conclusion:**
- The mean is: \(\square\) (Round to 3 decimal places as needed.)](/v2/_next/image?url=https%3A%2F%2Fcontent.bartleby.com%2Fqna-images%2Fquestion%2Fb8470e22-cdb6-4814-babe-099f6875e962%2Fcfe22461-e0fa-45f6-951e-8a4909b04afd%2Frf4iofy_processed.jpeg&w=3840&q=75)
Transcribed Image Text:**Educational Website Text**
**Finding the Mean for Data in a Frequency Distribution**
To find the mean for data items in a given frequency distribution, follow these steps:
**Table of Scores and Frequencies:**
| Score (x) | 1 | 2 | 3 | 4 | 5 | 6 | 7 | 8 | 9 | 10 |
|--------------|---|---|---|---|---|---|---|---|---|----|
| Frequency (f)| 1 | 2 | 1 | 6 | 5 | 9 | 5 | 3 | 3 | 3 |
**Calculating the Mean:**
1. **Multiply each score (x) by its corresponding frequency (f).**
- Example: x = 1, f = 1, so 1 * 1 = 1
- Continue this for all scores.
2. **Sum up all the products obtained in step 1.**
3. **Sum up all the frequencies (f).**
4. **Divide the sum of the products by the sum of the frequencies:**
\[
\text{Mean} = \frac{\sum (x \times f)}{\sum f}
\]
5. **Round the result to three decimal places as needed.**
**Example Conclusion:**
- The mean is: \(\square\) (Round to 3 decimal places as needed.)
Expert Solution
Step 1

Step by step
Solved in 2 steps with 2 images

Recommended textbooks for you
MATLAB: An Introduction with Applications
Statistics
ISBN:
9781119256830
Author:
Amos Gilat
Publisher:
John Wiley & Sons Inc

Probability and Statistics for Engineering and th…
Statistics
ISBN:
9781305251809
Author:
Jay L. Devore
Publisher:
Cengage Learning

Statistics for The Behavioral Sciences (MindTap C…
Statistics
ISBN:
9781305504912
Author:
Frederick J Gravetter, Larry B. Wallnau
Publisher:
Cengage Learning
MATLAB: An Introduction with Applications
Statistics
ISBN:
9781119256830
Author:
Amos Gilat
Publisher:
John Wiley & Sons Inc
Probability and Statistics for Engineering and th…
Statistics
ISBN:
9781305251809
Author:
Jay L. Devore
Publisher:
Cengage Learning
Statistics for The Behavioral Sciences (MindTap C…
Statistics
ISBN:
9781305504912
Author:
Frederick J Gravetter, Larry B. Wallnau
Publisher:
Cengage Learning

Elementary Statistics: Picturing the World (7th E…
Statistics
ISBN:
9780134683416
Author:
Ron Larson, Betsy Farber
Publisher:
PEARSON

The Basic Practice of Statistics
Statistics
ISBN:
9781319042578
Author:
David S. Moore, William I. Notz, Michael A. Fligner
Publisher:
W. H. Freeman

Introduction to the Practice of Statistics
Statistics
ISBN:
9781319013387
Author:
David S. Moore, George P. McCabe, Bruce A. Craig
Publisher:
W. H. Freeman