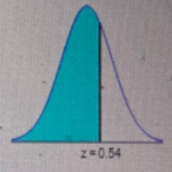
Find the area of the shaded region.


Optimization
Optimization comes from the same root as "optimal". "Optimal" means the highest. When you do the optimization process, that is when you are "making it best" to maximize everything and to achieve optimal results, a set of parameters is the base for the selection of the best element for a given system.
Integration
Integration means to sum the things. In mathematics, it is the branch of Calculus which is used to find the area under the curve. The operation subtraction is the inverse of addition, division is the inverse of multiplication. In the same way, integration and differentiation are inverse operators. Differential equations give a relation between a function and its derivative.
Application of Integration
In mathematics, the process of integration is used to compute complex area related problems. With the application of integration, solving area related problems, whether they are a curve, or a curve between lines, can be done easily.
Volume
In mathematics, we describe the term volume as a quantity that can express the total space that an object occupies at any point in time. Usually, volumes can only be calculated for 3-dimensional objects. By 3-dimensional or 3D objects, we mean objects that have length, breadth, and height (or depth).
Area
Area refers to the amount of space a figure encloses and the number of square units that cover a shape. It is two-dimensional and is measured in square units.
![**Standard Normal Distribution and Shaded Area Calculation**
To find the area of the shaded region under a standard normal distribution curve, you need to locate the z-score and use a standard normal distribution table.
**Problem Statement:**
The graph shown depicts a standard normal distribution with a mean of 0 and a standard deviation of 1.
- **Objective:**
- Find the area of the shaded region.
- Round the answer to four decimal places as needed.
**Instructions:**
1. **Z-Score Identification:**
- The graph shows a vertical line at \( z = 0.54 \).
- The shaded region is to the left of this line.
2. **Graph Description:**
- A bell-shaped curve with a shaded area on the left side up to \( z = 0.54 \) is displayed.
- This shaded area represents the probability of Z being less than or equal to 0.54 in a standard normal distribution.
3. **Table Access:**
- To determine the exact area, refer to a standard normal distribution table.
- Links labeled "Click to view page 1 of the table" and "Click to view page 2 of the table" are provided for guidance.
4. **Calculation:**
- Locate the z-score of 0.54 in the table to find the corresponding area.
- Enter this value in the provided space: The area of the shaded region is [ ].
This exercise helps enhance your understanding of normal distribution and proficiency in using statistical tables to compute probabilities.](/v2/_next/image?url=https%3A%2F%2Fcontent.bartleby.com%2Fqna-images%2Fquestion%2F751b40fa-4722-4db5-b37f-331db27c30bb%2F1292e58f-e96d-460c-865f-7da9251c9bb2%2Ff7tq7mq_processed.jpeg&w=3840&q=75)
Solution:
Given region is,
In this region, we have to find the area.

Trending now
This is a popular solution!

Step by step
Solved in 2 steps with 2 images


