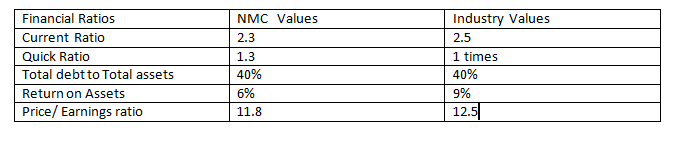
Financial Ratios Current Ratio Quick (Acid) Ratio Total Debt to Total Assets Return on Assets (ROA) Price/Earnings Ratio Industry Values 2.5 times 1.0 times 40% 6% 12.5 times NMC Values 2.3 1.3 40% 9% 11.8
Financial Ratios Current Ratio Quick (Acid) Ratio Total Debt to Total Assets Return on Assets (ROA) Price/Earnings Ratio Industry Values 2.5 times 1.0 times 40% 6% 12.5 times NMC Values 2.3 1.3 40% 9% 11.8

Chapter1: Financial Statements And Business Decisions
Section: Chapter Questions
Problem 1Q

Related questions

Question
What should NMC do to improve its position in the market?

Transcribed Image Text:Thousands of dollars (except stock
NMC Corporation Income Statement
for the Calendar Year (January 1-
December 31)
NMC Corporation Balance
Sheet (Average of beginning (thousands of
and end of year)
Assets
Liabilities and Equity
price, earnings per share, and
dividends per share)
(thousands of dollars)
dollars)
Net sales
Cost and expenses:
EBIT
Less interest expense:
$3,000
$2,734
$266
$50 Accounts payable
soNotes payable
$350 Accrued Wages
Cash
$60
Market securities
$100
$10
$130
Accounts receivable
$66
Inventories
Total Current Assets:
$300 Accrued Taxes
S700 Total Current Liabilities:
$1,300 Total Long Term Debt:
$300
$800
Earnings before taxes
$200
Taxes
80
Net plant and equipment:
Net income before preferred dividends
$120
Total Stock Holder's Equity:
$900
Dividends to preferred stockholders
S8
Total Assets:
$2,000 Total liabilities and equity:
$2,000|
Net income available to common stock
S112
holders
NMC Values
2.3
1.3
Industry Values
2.5 times
Per share common stock:
Financial Ratios
Stock Price
Earnings per share
Dividends per share
$26.50
Current Ratio
Quick (Acid) Ratio
Total Debt to Total Assets
S2.24
1.0 times
$1.84
40%
40%
Return on Assets (ROA)
Price/Earnings Ratio
6%
12.5 times
9%
11.8
CR= Current Assets/CurrentLiabilities
QR= Current Assets - Inventory/CurrentLiabilities
DA= Total Debt/Total Assets
NIAT = Earnings before taxes - taxes
ROA= NIAT/Assets
NMC should
To improve its position in the market.
EPS= NIAT/number of shares common stock
P/E= Market Price/EPS
Expert Solution
Step 1
The market Position of a company is measured by its ability to pay its current as well its long term debts and also when the earnings of the shareholders increase with the passage of time.

Trending now
This is a popular solution!

Step by step
Solved in 2 steps with 1 images

Knowledge Booster


Learn more about
Need a deep-dive on the concept behind this application? Look no further. Learn more about this topic, accounting and related others by exploring similar questions and additional content below.Recommended textbooks for you

Accounting
Accounting
ISBN:
9781337272094
Author:
WARREN, Carl S., Reeve, James M., Duchac, Jonathan E.
Publisher:
Cengage Learning,

Accounting Information Systems
Accounting
ISBN:
9781337619202
Author:
Hall, James A.
Publisher:
Cengage Learning,
Accounting
Accounting
ISBN:
9781337272094
Author:
WARREN, Carl S., Reeve, James M., Duchac, Jonathan E.
Publisher:
Cengage Learning,
Accounting Information Systems
Accounting
ISBN:
9781337619202
Author:
Hall, James A.
Publisher:
Cengage Learning,

Horngren's Cost Accounting: A Managerial Emphasis…
Accounting
ISBN:
9780134475585
Author:
Srikant M. Datar, Madhav V. Rajan
Publisher:
PEARSON

Intermediate Accounting
Accounting
ISBN:
9781259722660
Author:
J. David Spiceland, Mark W. Nelson, Wayne M Thomas
Publisher:
McGraw-Hill Education

Financial and Managerial Accounting
Accounting
ISBN:
9781259726705
Author:
John J Wild, Ken W. Shaw, Barbara Chiappetta Fundamental Accounting Principles
Publisher:
McGraw-Hill Education