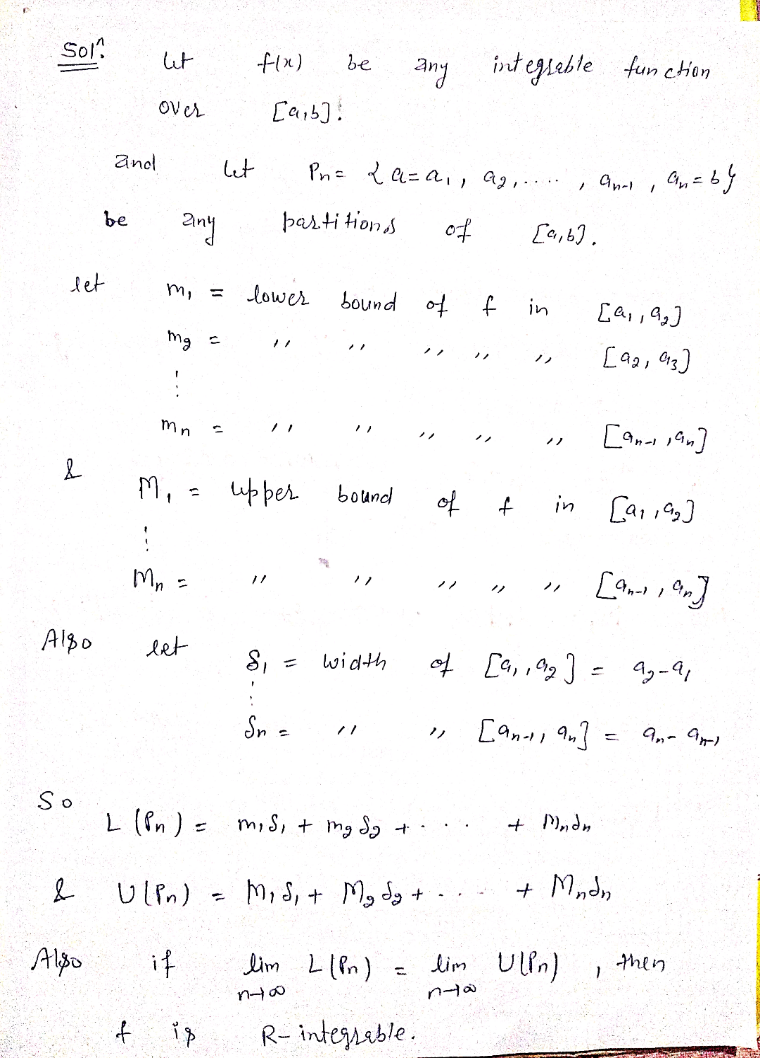
f (z) = -2r + 5 (1<1<2) Let P, be the partition {1,1+,1+.1+ = 2 } of [1,2). Calculate L(P.) and U(P.) and show f is Riemann integrable on [1, 2| and find
Q: CASE: You want to determine the degree/strength of relationship between height and weight. Variable…
A: Given that we want to determine the degree/strength of relationship between height and weight.…
Q: Calculate and give the value of the t test statistic? (3 dp): (Choose one from below) 205.9 0.193…
A: 1) From the scatter plot, there appears to be a moderate positive linear relation between the two…
Q: (b) Use a calculator to verify that Ex= 24.7, Ex²90.19, Ey-53.8, Ey²463.36 and Exy - 195.90.…
A:
Q: Part A The next questions are in relation to recent study of house prices in Sydney. The…
A: P – value is calculated from test statisitc and it helpful to make the decision about the hypothesis…
Q: Minimum Wage y 8 0 10 20 30 40 50 60 70 80 Years since 1940 The scatterplot above shows the…
A:
Q: An alternative expression for qualitative variables is numerical variables true or false ?
A: Introduction: A variable is considered to be qualitative, if its possible outcomes are labels or…
Q: QUESTION 23 The coefficient of determination a. cannot be negative. b. is the square root of the…
A: It is given that the statement about to the coefficient of determination.
Q: How can categorical or quantitative variables relate to the real world?
A: A Quantitative variable is the one who has a numerical significance attached to it like the quantity…
Q: Solve the normal equations and give an estimate of the intercept parameter, 60. Round your final…
A: Here the dependent variable is electricity usage.The independent variable is the production.Given…
Q: (b) Use a calculator to verify that Ex = 150.4, Ex² = 3251.86, Ey = 250, Ey² = 10630 and Exy =…
A: a.) The scatterplot of the data is
Q: Cori's Cola was to manufacture 500 cases of cola next week. The accountant provided the following…
A: The question is about regression Given : Coefficient of intercept ( b0 ) = 115 Coefficient of X…
Q: Practical importance is determined by the context of the problem (i.e. the field of interest) O…
A: Introduction: The hypothesis testing problem tests the statistical significance of a quantity of…
Q: Write an equation for the table below representing the relationship between the number of games and…
A: Given data: The given table is, x(number of games) 1 2 3 4 y(total cost in dollars) 5 8 11 14…
Q: The slope of a regression equation indicates where the regression line will cross the y-axis.
A: Introduction: Slope of a regression equation indicates the steepness of the regression line. The…
Q: Considering two variables in a regression equation = 1 125 + 0 375x The incorrect statement is 1 The…
A: Provided regression equation is: ŷ=1.125+0.325x It is of the form, y=β0+β1x where, β0 is intercept,…
Q: a. Does a linear equation do a good job of predicting the number of hits given the number of at…
A: Since you have posted a question with multiple sub-parts, we will solve first three sub-parts for…
Q: Part a though d please. Thank you!
A: Step 1:From scatterplot(Given);Predicted trash =1.026+10.48PeopleR-sq=73.3% Step 2:Part (a): Is the…
Q: Contribution $500 400 300 200 100 0 2 Years vs. Contributions 4 6 Years 8 10 12 Based on the above…
A: The objective of the question is to determine the relationship between two variables, years and…
Q: Column A Column B a. Women's hair growth may be due to 1. subject other factors, such as vitamins.…
A: We need to choose options from Column B that matches with Column A.
Q: Weber's law, a concept taught in most Introduction to Psychology courses, states that the ratio of…
A: The independent variable is Stimulus intensity. The dependent variable is Weber fraction. This is…
Q: Correlation and Regression: 7) Is there a relationship between how much cheese we eat and how…
A: hello thank you for the question. According to our honor code can answer only three sub parts at a…
Q: Explain the following: Dependent Variable Independent variable Moderating variable You can…
A: Dependent variable refers to the variable that we test or measure in an experiment. The value of…
Q: State the multiple regression equation. - 11.75 + (0.69 ) ×, + ( 0.84) X2, ound to two decimal…
A: The coefficient value of the revenue is 0.69 whereas the coefficient value of the efficiency is…
Q: A positive relationship exists when both variables increase or decrease at the same time. 1) True 2)…
A:
Q: LINEAR REGRESSION 2) During the last three months, on 10 occasions a sound equipment store appeared…
A: On 10 occasions a sound equipment store appeared in television commercials to promote…
Q: Typed plz
A: The objective of this question is to determine if the given data set (2, 4, 6, 8, 10) is…
Q: 4. Allison is planning a bridal shower for her daughter. She has decided on a budget of $3,000 to…
A: 4) Answer:- Given, Total budget = $ 3,000 Allison has budgeted $1,750 for food and dessert. So,…
Q: QUESTION 6 Let fo(x) = nx2 +5 for neN and x ER 4n +3 1. Show that (f.(x)) converges uniformly on [ -…
A: Since you have asked multiple question, we will solve the first question for you. If you want any…
Q: QUESTION 1 What is the interpretation of R2 = 0.92? O 8% of the variation in the Y-values is…
A: Coefficient of determination: Measures the proportion of total variation in the response Variable…
Q: Regression and correlation analysis both describe the strength of linear relationships between…
A: Information can be direct or curvilinear. Curvilinear fashion is that fashion when two variables are…
Q: For regress problems how do you find the R squared Value? Regress Y on X1, X2, X3, X4 and X5
A: Y on X1, X2, X3, X4, X5 is model of multiple regression. Here model will be framed as multiple…
Q: 10- 00 Sleep time A 9 2 0 O Both negative and linear O Positive 2 Number of Caffeinated Beverages…
A: A scatterplot is a graphical representation which helps in understanding the relationship b/w the 2…
Q: How to do comparing linear functions word problems
A:
Q: Question 2 (8 points) Write an equation for the table below representing the relationship between…
A:
Q: can you help me explain the diagram
A: Here we have a diagram that shows some independent variables, some moderating elements and dependent…
Q: Fuel The table below shows data for the numberof gallons of gas purchased each day x of a…
A: From the table above we can observe that ,Gas used is independent of the number of days from first…
Step by step
Solved in 3 steps with 3 images
- AAAAAAA Number of People Killed 3.50 300 250 200 150 100 50 0 -50 -100 -150 4 5 6 Magnitude of Earthquake 12 The relationship between the magnitude of the earthquake and the number of people killed is influenced by the country in which the earthquake takes place. Some countries have building codes that produce buildings that better withstand the damage of an earthquake than buildings in some other countries. In this scenario, the country in which an earthquake takes place is which of the following? Extrapolation Outlier Lurking variable Residual Influential Observation 3 7 10 -How far a person travelled to get an ice cream at Scoops Parlour shop. This represents a discrete variable This represents a continuous variableI need the answer as soon as possible
- #1 = 2 O Continue = 3 (a) University in which a student is enrolled 2 Variable (b) Dosage (in milligrams) of medication F2 or each of the variables described below, indicate whether it is a quantitative or a categorical (qualitative) variable. Als the variable: nominal, ordinal, interval, or ratio. Make sure your responses are the most specific possible. (c) Playing time (in seconds) of a DVD W 4,723 = 4 w# 3 80 F3 E = 5 C 4 SEP 16 R Type of variable OQuantitative Categorical 6 O Quantitative Categorical O Quantitative Categorical 85 % F E # F5 7 T Level of measurement O Nominal Ordinal Interval Ratio Nominal Ordinal Interval O Ratio Nominal Ordinal Interval Ratio 6 tv MacBook Air G 8 ♫A Y 7 H 9 X =NUTES ©2022 McGraw Hill LLC. All Righ 8 10 3 U J ( 9 1In-text Activities: Firm-Up/Deepen Activities A relationship between two variables in such a way that one quantity increases or decreases the other quantity also increases or decreases in a definite way is called a variation. Direct variation indicates that when.. x (independent variable) increases, y (dependent variable) also increases x (independent variable) decreases, y (dependent variable) also decreases Graphically speaking, we can present direct variation 14마 (4 hrs, 120 mil Mathematically speaking, we can denote direct variation in the equation. y = kx where x is the independent variable y is the dependent variable k is the constant 3 3 hrs, 90 miles) (2 hrs, 60 miles) 2아 (I hr, 30 miles) Verbally speaking, we can denote y = kx on the ff equivalent statements "y varies directly as x" "y varies as x" "y varies with x" "y is proportional to x' "y is directly proportional to x" As the number of hours increases, the distance increases. distance = dependent h varies directly as d…How much should a healthy Shetland pony weigh? Let x be the age of the pony (in months), and let y be the average weight of the pony (in kilograms). x 3 6 12 20 26 y 60 95 140 160 189 (a) Make a scatter diagram of the data and visualize the line you think best fits the data. Flash Player version 10 or higher is required for this question. You can get Flash Player free from Adobe's website. (b) Would you say the correlation is low, moderate, or strong? low moderate strong Would you say the correlation is positive or negative? positive negative (c) Use a calculator to verify that x = 67, x2 = 1265, y = 644, y2 = 93,546, and xy = 10,544. Compute r. (Round your answer to three decimal places.) As x increases from 3 to 26 months, does the value of r imply that y should tend to increase or decrease? Explain your answer. Given our value of r, y should…
- Any help with any of the questions is appreciated thank you!Linear Modeling 1. Some phone apps measure the number of steps taken during a period of time. John downloaded an app that reported data in a table like this: Time Steps Steps taken taken (minutes) 600 4000 20 2400 25 3000 4200 3000 35 2000 1000 10 20 30 40 Minutes (a) What are the variables of the problem? Identify independent and/or dependent variables of the problem if any. (b) Use the information from the table to graph the number of steps that John has taken over time. Connect the points on your graph. Does this curve or is it a line? (c) Explain why the graph tells you that John is walking at a constant pace. МacВook Air DII DD 80 F10 F9 F6 F7 F8 F5 F2 F3 F4 & 23 2$ 3 4 5 6. 7 8 9. E R Y U F H J K L. * 00Question #1
- Please help me with solutions to these questions.Español Weber's law, a concept taught in most Introduction to Psychology courses, states that the ratio of the intensity of a stimulus to the "just noticeable" increment in intensity is constant, that is, the ratio doesn't depend on the intensity of the stimulus. The ratio is called the "Weber fraction," so a concise statement of Weber's law is that "the Weber fraction is constant, regardless of the stimulus intensity." It turns out that Weber's law is not so much a law as it is a rule of thumb, since it is violated in many situations. For instance, for some auditory stimuli, the Weber fraction does depend systematically on the stimulus intensity. The following bivariate data are the experimental data obtained for one listener in an auditory intensity discrimination task. For each of the ten stimulus intensities x (in decibels), the Weber fraction y (in decibels) is shown. Figure 1 is a scatter plot of the data. Also given is the product of the stimulus intensity and the Weber fraction…A variable which can assume any value within a given range is _______________ a. Discrete variable b. Quantitative variable c. Continuous variable d. Qualitative variable