f (Hz) x (m) 1/f (s) 2x (m) 523.251 0.34 0.001911 0.68 587.33 0.20 0.001703 0.58 859.255 0 27 0.001517 0.54 608.450 0.20 0.001432 0.52 783.001 0.22 0.001270 0.44 880 02 0.001130 0.4 987.767 0.175 0.00 1012 0.35 1040.5 0.17 0.000050 0.34 The physics theory describing standing sound waves in a column of air suggests an appropriate plot of you data above yields a linear relationship with a slope proportional to the speed of sound. Make this plot in Excel and use LINEST to find the slope and error of the slope. Then find the speed of sound and its uncertainty. Enter the results of this work below and submit a PDF of the plot you generated (with axes labels. line-of-best-fit and equation of fit, units, and caption) below using the "Show Your Work" function, Instructions on making a PDF can be found here. Also, calculate the theoretical speed of sound during your experiment using the measured temperature in the lab and enter this result and the percent error of your experimental value below. slope = 353.2085 *13.39807 V m/s v 13.30807 m/s 353.2685 *0.5 v °C temp =10.0 210.303 v p/s Veheory 342814 percent error =8.83861210
f (Hz) x (m) 1/f (s) 2x (m) 523.251 0.34 0.001911 0.68 587.33 0.20 0.001703 0.58 859.255 0 27 0.001517 0.54 608.450 0.20 0.001432 0.52 783.001 0.22 0.001270 0.44 880 02 0.001130 0.4 987.767 0.175 0.00 1012 0.35 1040.5 0.17 0.000050 0.34 The physics theory describing standing sound waves in a column of air suggests an appropriate plot of you data above yields a linear relationship with a slope proportional to the speed of sound. Make this plot in Excel and use LINEST to find the slope and error of the slope. Then find the speed of sound and its uncertainty. Enter the results of this work below and submit a PDF of the plot you generated (with axes labels. line-of-best-fit and equation of fit, units, and caption) below using the "Show Your Work" function, Instructions on making a PDF can be found here. Also, calculate the theoretical speed of sound during your experiment using the measured temperature in the lab and enter this result and the percent error of your experimental value below. slope = 353.2085 *13.39807 V m/s v 13.30807 m/s 353.2685 *0.5 v °C temp =10.0 210.303 v p/s Veheory 342814 percent error =8.83861210

College Physics
11th Edition
ISBN:9781305952300
Author:Raymond A. Serway, Chris Vuille
Publisher:Raymond A. Serway, Chris Vuille
Chapter1: Units, Trigonometry. And Vectors
Section: Chapter Questions
Problem 1CQ: Estimate the order of magnitude of the length, in meters, of each of the following; (a) a mouse, (b)...

Related questions
Question
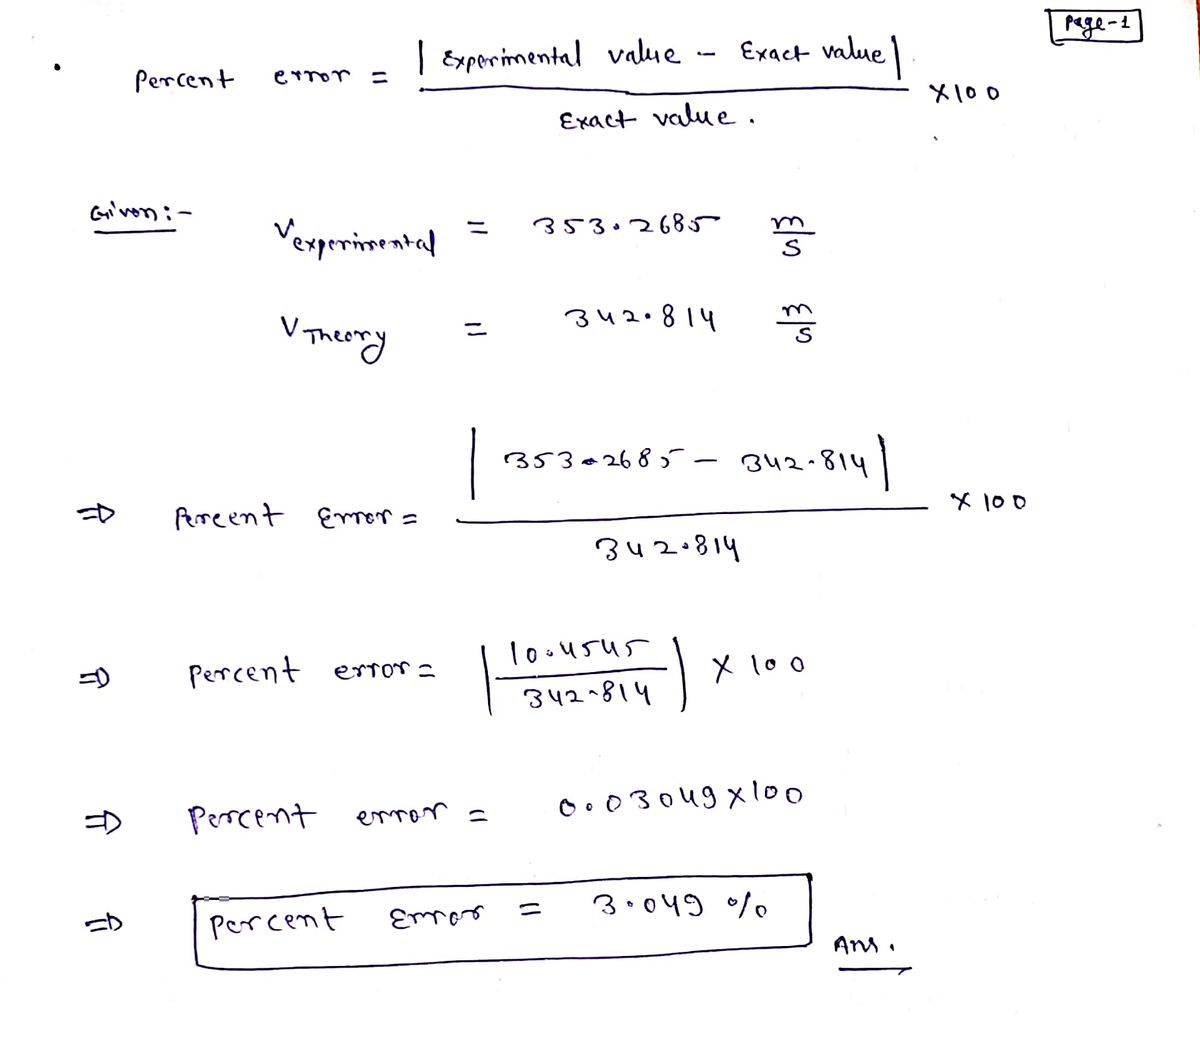
Find percent error

Transcribed Image Text:f (Hz)
x (m)
1/f (s)
2ж (m)
523.251
0.001911
0.68
0.34
587.33
0.20
0.001703
0.58
650.255
0.54
0.27
0.001517
608.450
0.20
0.001432
0.52
783.001
0.22
0.001270
0.44
880
02
0.001136
04
987.767
0.175
0.00 1012
0.35
1040.5
0.17
0.000056
0.34
The physics theory describing standing sound waves in a column of air suggests an appropriate plot of you data above yields a linear relationship with a slope proportional to the speed of sound. Make this plot in Excel and use LINEST to
find the slope and error of the slope. Then find the speed of sound and its uncertainty. Enter the results of this work below and submit a PDF of the plot you generated (with axes labels, line-of-best-fit and equation of fit, units, and
caption) below using the "Show Your Work" function, Instructions on making a PDF can be found here. Also, calculate the theoretical speed of sound during your experiment using the measured temperature in the lab and enter this result
and the percent error of your experimental value below.
13.39807
v m/s
slope = 353.2005
v
2 13.30807
m/s
353.2685
*0.5
V °C
temp 10.0
210.303
V p/s
Veheory= 342 814
percent error =8.83861210
Expert Solution
Step 1

Trending now
This is a popular solution!

Step by step
Solved in 2 steps with 1 images

Knowledge Booster


Learn more about
Need a deep-dive on the concept behind this application? Look no further. Learn more about this topic, physics and related others by exploring similar questions and additional content below.Recommended textbooks for you
College Physics
Physics
ISBN:
9781305952300
Author:
Raymond A. Serway, Chris Vuille
Publisher:
Cengage Learning

University Physics (14th Edition)
Physics
ISBN:
9780133969290
Author:
Hugh D. Young, Roger A. Freedman
Publisher:
PEARSON

Introduction To Quantum Mechanics
Physics
ISBN:
9781107189638
Author:
Griffiths, David J., Schroeter, Darrell F.
Publisher:
Cambridge University Press
College Physics
Physics
ISBN:
9781305952300
Author:
Raymond A. Serway, Chris Vuille
Publisher:
Cengage Learning
University Physics (14th Edition)
Physics
ISBN:
9780133969290
Author:
Hugh D. Young, Roger A. Freedman
Publisher:
PEARSON
Introduction To Quantum Mechanics
Physics
ISBN:
9781107189638
Author:
Griffiths, David J., Schroeter, Darrell F.
Publisher:
Cambridge University Press

Physics for Scientists and Engineers
Physics
ISBN:
9781337553278
Author:
Raymond A. Serway, John W. Jewett
Publisher:
Cengage Learning

Lecture- Tutorials for Introductory Astronomy
Physics
ISBN:
9780321820464
Author:
Edward E. Prather, Tim P. Slater, Jeff P. Adams, Gina Brissenden
Publisher:
Addison-Wesley

College Physics: A Strategic Approach (4th Editio…
Physics
ISBN:
9780134609034
Author:
Randall D. Knight (Professor Emeritus), Brian Jones, Stuart Field
Publisher:
PEARSON