Exhibit 1 gives a frequency distribution table of age of the individuals who are smokers. a) Using Exhibit 1 above, describe how you would find the age group which contains the median smokers. Specify the age group.
Exhibit 1 gives a frequency distribution table of age of the individuals who are smokers. a) Using Exhibit 1 above, describe how you would find the age group which contains the median smokers. Specify the age group.

MATLAB: An Introduction with Applications
6th Edition
ISBN:9781119256830
Author:Amos Gilat
Publisher:Amos Gilat
Chapter1: Starting With Matlab
Section: Chapter Questions
Problem 1P

Related questions
Question
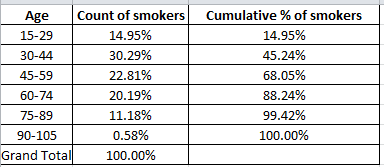
Exhibit 1 gives a frequency distribution table of age of the individuals who are smokers.
a) Using Exhibit 1 above, describe how you would find the age group which contains the

Transcribed Image Text:Age
15-29
30-44
45-59
60-74
75-89
90-105
Grand
Total
Exhibit 1
Count of smokers
14.95%
30.29%
22.81%
20.19%
11.18%
0.58%
100.00%
Cumulative % of
smokers
14.95%
45.24%
68.05%
88.24%
99.42%
100.00%
Expert Solution
Step 1: Determine the given variables.
The question is about measures.
Given :
To find :
Age group which contains the median smokers.

Step by step
Solved in 3 steps with 2 images

Recommended textbooks for you
MATLAB: An Introduction with Applications
Statistics
ISBN:
9781119256830
Author:
Amos Gilat
Publisher:
John Wiley & Sons Inc

Probability and Statistics for Engineering and th…
Statistics
ISBN:
9781305251809
Author:
Jay L. Devore
Publisher:
Cengage Learning

Statistics for The Behavioral Sciences (MindTap C…
Statistics
ISBN:
9781305504912
Author:
Frederick J Gravetter, Larry B. Wallnau
Publisher:
Cengage Learning
MATLAB: An Introduction with Applications
Statistics
ISBN:
9781119256830
Author:
Amos Gilat
Publisher:
John Wiley & Sons Inc
Probability and Statistics for Engineering and th…
Statistics
ISBN:
9781305251809
Author:
Jay L. Devore
Publisher:
Cengage Learning
Statistics for The Behavioral Sciences (MindTap C…
Statistics
ISBN:
9781305504912
Author:
Frederick J Gravetter, Larry B. Wallnau
Publisher:
Cengage Learning

Elementary Statistics: Picturing the World (7th E…
Statistics
ISBN:
9780134683416
Author:
Ron Larson, Betsy Farber
Publisher:
PEARSON

The Basic Practice of Statistics
Statistics
ISBN:
9781319042578
Author:
David S. Moore, William I. Notz, Michael A. Fligner
Publisher:
W. H. Freeman

Introduction to the Practice of Statistics
Statistics
ISBN:
9781319013387
Author:
David S. Moore, George P. McCabe, Bruce A. Craig
Publisher:
W. H. Freeman