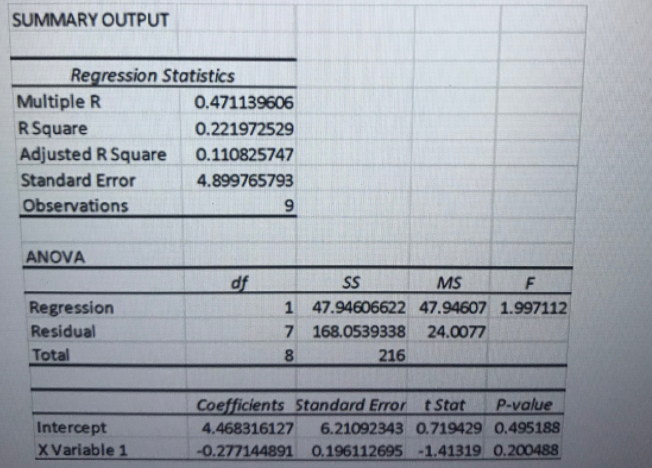
Examine the following Excel regression printout. Identify the coefficient for the independent variable. Round answers to 3 decimal places. SUMMARY OUTPUT Regression Statistics Multiple R 0.471139606 RSquare 0.221972529 Adjusted R Square 0.110825747 Standard Error 4.899765793 Observations ANOVA df SS MS 1 47.94606622 47.94607 1.997112 7 168.0539338 Regression Residual 24.0077 Total 8 216 Coefficients Standard Error t Stat P-value 6.21092343 0.719429 0.495188 -0.277144891 0.196112695 -1.41319 0.200488 Intercept 4.468316127 XVariable 1


Correlation
Correlation defines a relationship between two independent variables. It tells the degree to which variables move in relation to each other. When two sets of data are related to each other, there is a correlation between them.
Linear Correlation
A correlation is used to determine the relationships between numerical and categorical variables. In other words, it is an indicator of how things are connected to one another. The correlation analysis is the study of how variables are related.
Regression Analysis
Regression analysis is a statistical method in which it estimates the relationship between a dependent variable and one or more independent variable. In simple terms dependent variable is called as outcome variable and independent variable is called as predictors. Regression analysis is one of the methods to find the trends in data. The independent variable used in Regression analysis is named Predictor variable. It offers data of an associated dependent variable regarding a particular outcome.

Given:

Step by step
Solved in 2 steps with 1 images


