est 3 est 4 1.00 Correlations for Entire Sample (repeated) est_1 est_2 est_3 est_4 Pearson Correlation Sig. (2-tailed) N Pearson Correlation Sig. (2-tailed) N Pearson Correlation Sig. (2-tailed) N 1.00 Pearson Correlation Sig. (2-tailed) N Correlations Test 1 1.000 100 -.049 .625 100 -410" .000 100 .817" .000 100 Test 2 -.049 .625 100 1.000 100 .369" .000 100 -210° .036 100 **. Correlation is significant at the 0.01 level (2-tailed). *. Correlation is significant at the 0.05 level (2-tailed). Test 3 -410" .000 100 .369" .000 100 1.000 100 -.534 .000 100 Test 4 .817" .000 100 -210* .036 100 -.534" .000 100 1.000 100 Which pair of tests has the strongest overall correlation? Test and Test r = Which pair of tests has the strongest positive correlation? Test and Test = Which pair of tests has the strongest negative correlation? and Test Test r= Which pair of tests has the weakest overall correlation? Test and Test r = Which pair of tests has the weakest positive correlation? Test and Test r = Which pair of tests has the weakest negative correlation? Test and Test r = Which pair(s) of tests had a correlation significantly greater than (different from) zero? Hint: you will need to look back at the SPSS output.
est 3 est 4 1.00 Correlations for Entire Sample (repeated) est_1 est_2 est_3 est_4 Pearson Correlation Sig. (2-tailed) N Pearson Correlation Sig. (2-tailed) N Pearson Correlation Sig. (2-tailed) N 1.00 Pearson Correlation Sig. (2-tailed) N Correlations Test 1 1.000 100 -.049 .625 100 -410" .000 100 .817" .000 100 Test 2 -.049 .625 100 1.000 100 .369" .000 100 -210° .036 100 **. Correlation is significant at the 0.01 level (2-tailed). *. Correlation is significant at the 0.05 level (2-tailed). Test 3 -410" .000 100 .369" .000 100 1.000 100 -.534 .000 100 Test 4 .817" .000 100 -210* .036 100 -.534" .000 100 1.000 100 Which pair of tests has the strongest overall correlation? Test and Test r = Which pair of tests has the strongest positive correlation? Test and Test = Which pair of tests has the strongest negative correlation? and Test Test r= Which pair of tests has the weakest overall correlation? Test and Test r = Which pair of tests has the weakest positive correlation? Test and Test r = Which pair of tests has the weakest negative correlation? Test and Test r = Which pair(s) of tests had a correlation significantly greater than (different from) zero? Hint: you will need to look back at the SPSS output.

MATLAB: An Introduction with Applications
6th Edition
ISBN:9781119256830
Author:Amos Gilat
Publisher:Amos Gilat
Chapter1: Starting With Matlab
Section: Chapter Questions
Problem 1P

Related questions
Question
Based on the above

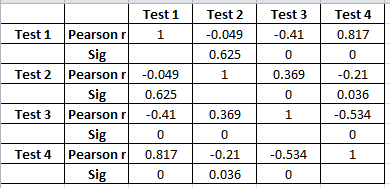
Transcribed Image Text:Test 2
Test 1 1.00
Test 3
Test 4
Test 1
Test 2
Correlations for Entire Sample (N =
Test 3
Test 1 Test 2 Test 3 Test 4
Test 4
1.00
Correlations for Entire Sample (repeated)
1.00
Pearson Correlation
Sig. (2-tailed)
N
Pearson Correlation
Sig. (2-tailed)
N
Pearson Correlation
Sig. (2-tailed)
N
1.00
Pearson Correlation.
Sig. (2-tailed)
N
Correlations
Test 1
1.000
100
-.049
.625
100
-.410"
.000
100
.817"
.000
100
Test 2
-.049
.625
100
1.000
100
.369"
.000
100
-,210
.036
100
**. Correlation is significant at the 0.01 level (2-tailed).
*. Correlation is significant at the 0.05 level (2-tailed).
Test 3
-.410"
.000
100
.369"
,000
100
1.000
100
-.534"
,000
100
Test 4
.817"
.000
100
-210
.036
100
-.534"
.000
100
1.000
)
100
Which pair of tests has the strongest overall correlation?
Test
and Test
r =
Which pair of tests has the strongest positive correlation?
Test
and Test
Which pair of tests has the strongest negative correlation?
Test
and
Test
r=
Which pair of tests has the weakest overall correlation?
Test
and
Test
r =
Which pair of tests has the weakest positive correlation?
Test
and
Test
r =
Which pair of tests has the weakest negative correlation?
Test
and
Test
=
r =
Which pair(s) of tests had a correlation significantly greater
than (different from) zero? Hint: you will need to look back at
the SPSS output.
Expert Solution
Step 1
The question is about correlation
Given :
Correlation matrix :
To find which pair of test has
1 ) Overall strongest correlation
2 ) Strongest positive correlation
3 ) Strongest negative correlation
4 ) Weakest overall correlation
5 ) Weakest positive correlation
6 ) Weakest negative correlation

Step by step
Solved in 2 steps with 2 images

Recommended textbooks for you
MATLAB: An Introduction with Applications
Statistics
ISBN:
9781119256830
Author:
Amos Gilat
Publisher:
John Wiley & Sons Inc

Probability and Statistics for Engineering and th…
Statistics
ISBN:
9781305251809
Author:
Jay L. Devore
Publisher:
Cengage Learning

Statistics for The Behavioral Sciences (MindTap C…
Statistics
ISBN:
9781305504912
Author:
Frederick J Gravetter, Larry B. Wallnau
Publisher:
Cengage Learning
MATLAB: An Introduction with Applications
Statistics
ISBN:
9781119256830
Author:
Amos Gilat
Publisher:
John Wiley & Sons Inc
Probability and Statistics for Engineering and th…
Statistics
ISBN:
9781305251809
Author:
Jay L. Devore
Publisher:
Cengage Learning
Statistics for The Behavioral Sciences (MindTap C…
Statistics
ISBN:
9781305504912
Author:
Frederick J Gravetter, Larry B. Wallnau
Publisher:
Cengage Learning

Elementary Statistics: Picturing the World (7th E…
Statistics
ISBN:
9780134683416
Author:
Ron Larson, Betsy Farber
Publisher:
PEARSON

The Basic Practice of Statistics
Statistics
ISBN:
9781319042578
Author:
David S. Moore, William I. Notz, Michael A. Fligner
Publisher:
W. H. Freeman

Introduction to the Practice of Statistics
Statistics
ISBN:
9781319013387
Author:
David S. Moore, George P. McCabe, Bruce A. Craig
Publisher:
W. H. Freeman