Enter the data into Excel and use Excel for your calculations. Enter the exact answers. a) y-intercept, bo %3D b) slope, b1 What is the MSE if this model is used to forecast sales for time periods 1-5?


Continuous Probability Distributions
Probability distributions are of two types, which are continuous probability distributions and discrete probability distributions. A continuous probability distribution contains an infinite number of values. For example, if time is infinite: you could count from 0 to a trillion seconds, billion seconds, so on indefinitely. A discrete probability distribution consists of only a countable set of possible values.
Normal Distribution
Suppose we had to design a bathroom weighing scale, how would we decide what should be the range of the weighing machine? Would we take the highest recorded human weight in history and use that as the upper limit for our weighing scale? This may not be a great idea as the sensitivity of the scale would get reduced if the range is too large. At the same time, if we keep the upper limit too low, it may not be usable for a large percentage of the population!
6) see pic

6)
a)
The regression analysis is conducted using EXCEL. The software procedure is given below:
- Enter the data.
- Select Data > Data Analysis >Regression> OK.
- Enter Input Y Range as B1:B6.
- Enter Input X Range as A1:A6.
- Mark Labels.
- Click OK.
The output using EXCEL is as follows:
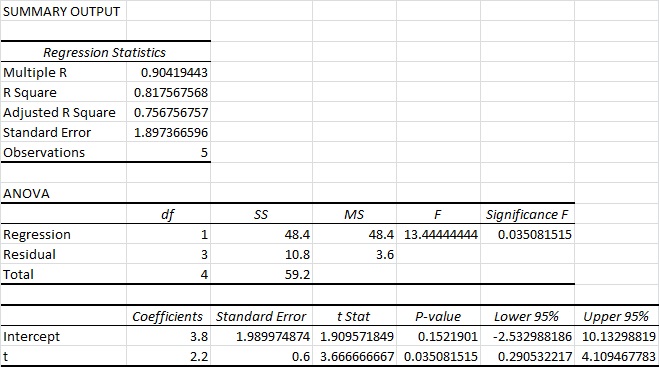
From the output, the y-intercept is 3.8.
Thus, the y-intercept is 3.8.

Step by step
Solved in 2 steps with 1 images


