Eight thousand lottery tickets are sold for $5 One ticket will win $2,000, two tickets will win $1000 each, four tickets will win $500 each and eight tickets will win $100each. Let Xdenote the NET gain from the purchase of a randomly selected ticket. Construct the probability distribution of X. Compute the expected value E(X)of X. Interpret its meaning. Compute the standard deviation σ of X.


Contingency Table
A contingency table can be defined as the visual representation of the relationship between two or more categorical variables that can be evaluated and registered. It is a categorical version of the scatterplot, which is used to investigate the linear relationship between two variables. A contingency table is indeed a type of frequency distribution table that displays two variables at the same time.
Binomial Distribution
Binomial is an algebraic expression of the sum or the difference of two terms. Before knowing about binomial distribution, we must know about the binomial theorem.
- Eight thousand lottery tickets are sold for $5 One ticket will win $2,000, two tickets will win $1000 each, four tickets will win $500 each and eight tickets will win $100each. Let Xdenote the NET gain from the purchase of a randomly selected ticket.
- Construct the
probability distribution of X. - Compute the
expected value E(X)of X. Interpret its meaning. - Compute the standard deviation σ of X.
a)
The number of tickets is 8000 and is sold at $5 each.
The number of ticket with prize of $2,000 is 1.
The number of ticket with prize of $1,000 is 2.
The number of ticket with prize of $500 is 4.
The number of ticket with prize of $100 is 8.
Let x be the random variable that represents your net gain.
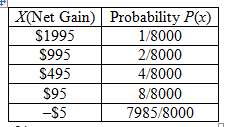
The probability distribution as follows is,
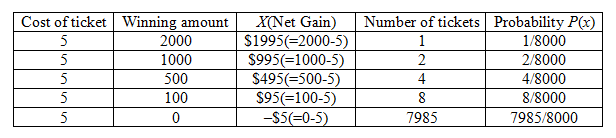
The probability distribution of X is given by:

Step by step
Solved in 4 steps with 4 images


