e. Use Excel's statistical functions, such as "=average", to get the mean, median, range, variance, and standard deviation. Get a printout with the labels and the values of these statistics. f. Use Excel's Descriptive Statistics in Data Analysis to get the descriptive statistics printout. g. Identify mean, median, mode, range, variance, and standard deviation from the Excel Descriptive Statistics printout. h. Calculate the intervals (x + ks) for k = 1, 2, 3 and tabulate the number of data and the percentage of data falling in each of these intervals. x is the sample mean and s is the sample standard deviation. Your table should be similar to one on page 22 of the course packet. What is the Empirical Rule? Do the results obtained in the part h agree with those given by the Empirical Rule? i.
e. Use Excel's statistical functions, such as "=average", to get the mean, median, range, variance, and standard deviation. Get a printout with the labels and the values of these statistics. f. Use Excel's Descriptive Statistics in Data Analysis to get the descriptive statistics printout. g. Identify mean, median, mode, range, variance, and standard deviation from the Excel Descriptive Statistics printout. h. Calculate the intervals (x + ks) for k = 1, 2, 3 and tabulate the number of data and the percentage of data falling in each of these intervals. x is the sample mean and s is the sample standard deviation. Your table should be similar to one on page 22 of the course packet. What is the Empirical Rule? Do the results obtained in the part h agree with those given by the Empirical Rule? i.

MATLAB: An Introduction with Applications
6th Edition
ISBN:9781119256830
Author:Amos Gilat
Publisher:Amos Gilat
Chapter1: Starting With Matlab
Section: Chapter Questions
Problem 1P

Related questions
Question

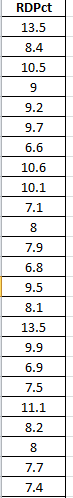
Transcribed Image Text:RDPct
13.5
8.4
10.5
9
9.2
9.7
6.6
10.6
10.1
7.1
8
7.9
6.8
9.5
8.1
13.5
9.9
6.9
7.5
11.1
8.2
8
7.7
7.4
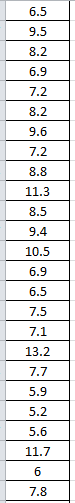
6.5
9.5
8.2
6.9
7.2
8.2
9.6
7.2
8.8
11.3
8.5
9.4
10.5
6.9
6.5
7.5
7.1
13.2
7.7
5.9
5.2
5.6
11.7
6
7.8
6.5

Transcribed Image Text:e.
f.
g.
h.
i.
Use Excel's statistical functions, such as "=average", to get the mean, median, range, variance,
and standard deviation. Get a printout with the labels and the values of these statistics.
Use Excel's Descriptive Statistics in Data Analysis to get the descriptive statistics printout.
Identify mean, median, mode, range, variance, and standard deviation from the Excel
Descriptive Statistics printout.
Calculate the intervals (x + ks) for k = 1, 2, 3 and tabulate the number of data and the
percentage of data falling in each of these intervals. x is the sample mean and s is the sample
standard deviation. Your table should be similar to one on page 22 of the course packet.
What is the Empirical Rule? Do the results obtained in the part h agree with those given by the
Empirical Rule?
Expert Solution
Step 1
Since you have posted a question with multiple sub-parts, we will solve first 3 sub-parts for you. To get the remaining sub-parts solved, please repost the complete question and mention the sub-parts to be solved
The question is about descriptive stats
Given :

To find :
e ) Mean, median, range, variance, std. deviation using excel's statistical functions
f ) Descriptive stats using data analysis
g ) Identify values of mean, median, range, variance, std. deviation from part e output

Step by step
Solved in 2 steps with 9 images

Recommended textbooks for you
MATLAB: An Introduction with Applications
Statistics
ISBN:
9781119256830
Author:
Amos Gilat
Publisher:
John Wiley & Sons Inc

Probability and Statistics for Engineering and th…
Statistics
ISBN:
9781305251809
Author:
Jay L. Devore
Publisher:
Cengage Learning

Statistics for The Behavioral Sciences (MindTap C…
Statistics
ISBN:
9781305504912
Author:
Frederick J Gravetter, Larry B. Wallnau
Publisher:
Cengage Learning
MATLAB: An Introduction with Applications
Statistics
ISBN:
9781119256830
Author:
Amos Gilat
Publisher:
John Wiley & Sons Inc
Probability and Statistics for Engineering and th…
Statistics
ISBN:
9781305251809
Author:
Jay L. Devore
Publisher:
Cengage Learning
Statistics for The Behavioral Sciences (MindTap C…
Statistics
ISBN:
9781305504912
Author:
Frederick J Gravetter, Larry B. Wallnau
Publisher:
Cengage Learning

Elementary Statistics: Picturing the World (7th E…
Statistics
ISBN:
9780134683416
Author:
Ron Larson, Betsy Farber
Publisher:
PEARSON

The Basic Practice of Statistics
Statistics
ISBN:
9781319042578
Author:
David S. Moore, William I. Notz, Michael A. Fligner
Publisher:
W. H. Freeman

Introduction to the Practice of Statistics
Statistics
ISBN:
9781319013387
Author:
David S. Moore, George P. McCabe, Bruce A. Craig
Publisher:
W. H. Freeman