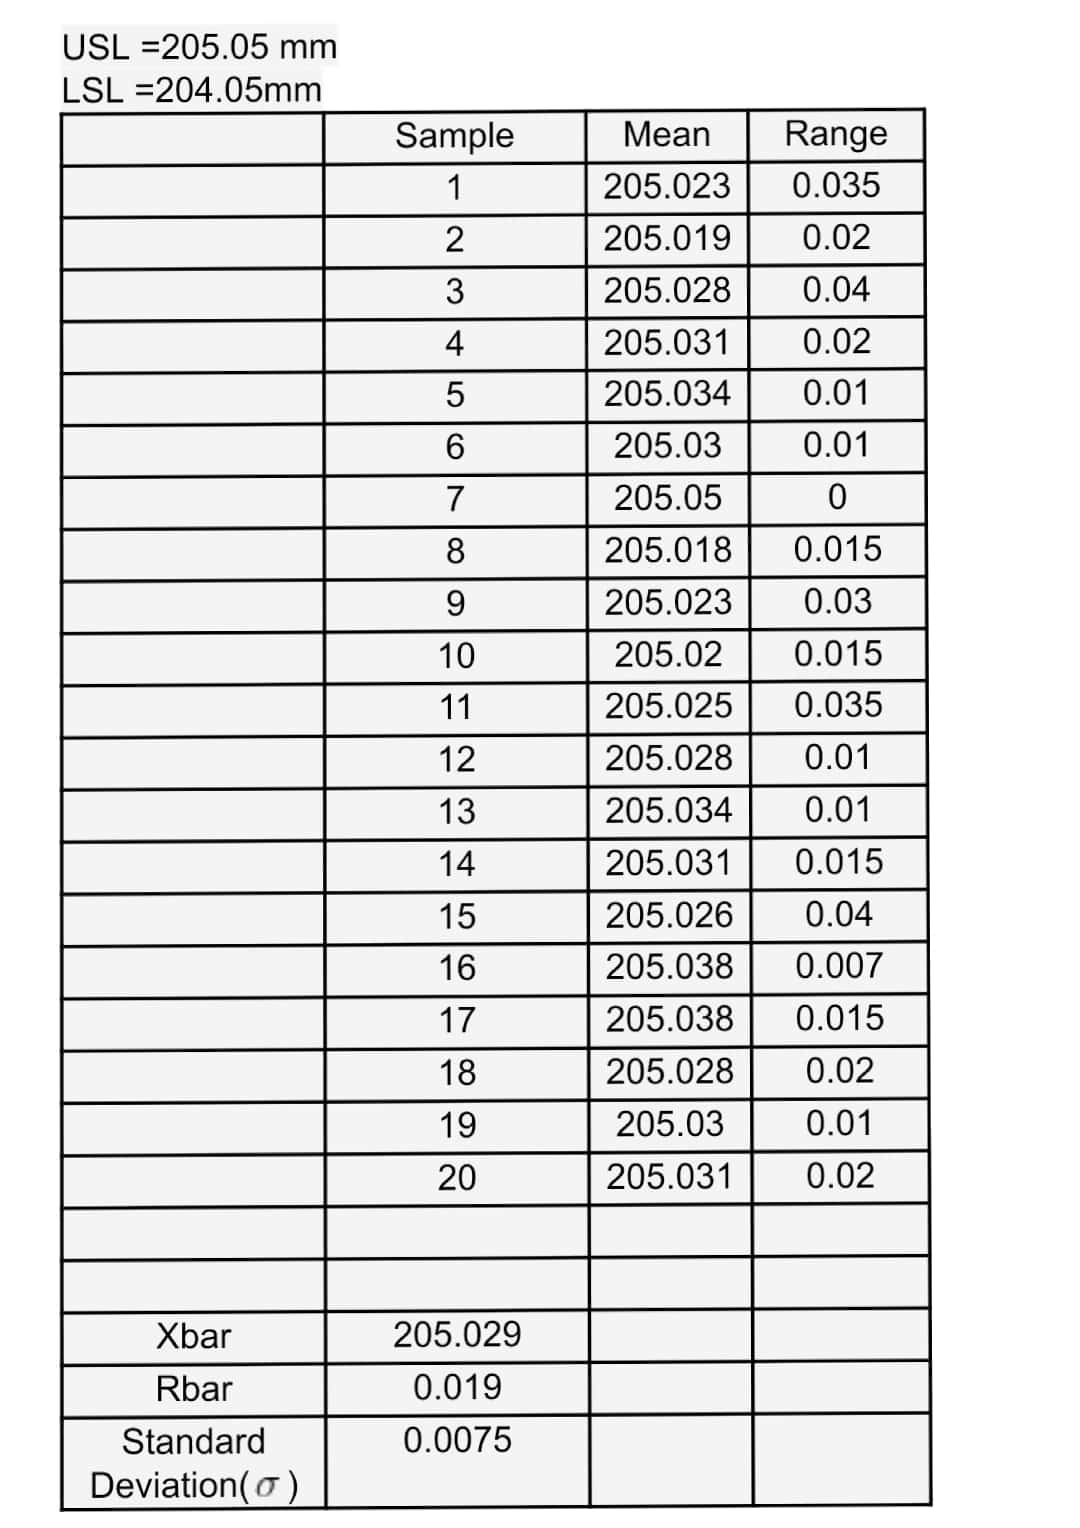
During the manufacture of the driver gear of an automobile, a dial bore gauge is used to bore a hole into cast steel. Specifications require that the diameter of the bore hole be between 204.05 and 205.05 millimeters, with a target mean of 205 millimeters. The International Journal of Quality Research (Vol. 8, 2014) applied capability analysis to assess the performance of the boring operation. Five driver gear parts were sampled each hour for 20 consecutive hours, and the bore diameter of each part was determined. The data are presented in the file BORE.xlsx. Run a complete capability analysis on the data. How would you categorize the performance of the boring process? Is the process under control. Find the capability index and plot the X-bar chart to support your argument.
During the manufacture of the driver gear of an automobile, a dial bore gauge is used to bore a hole into cast steel. Specifications require that the diameter of the bore hole be between 204.05 and 205.05 millimeters, with a target mean of 205 millimeters. The International Journal of Quality Research (Vol. 8, 2014) applied capability analysis to assess the performance of the boring operation. Five driver gear parts were sampled each hour for 20 consecutive hours, and the bore diameter of each part was determined. The data are presented in the file BORE.xlsx. Run a complete capability analysis on the data. How would you categorize the performance of the boring process? Is the process under control. Find the capability index and plot the X-bar chart to support your argument.

MATLAB: An Introduction with Applications
6th Edition
ISBN:9781119256830
Author:Amos Gilat
Publisher:Amos Gilat
Chapter1: Starting With Matlab
Section: Chapter Questions
Problem 1P

Related questions
Question

Transcribed Image Text:This image shows a spreadsheet with data organized in columns and rows, likely representing measurements or observations of different samples. Below is the transcribed content:
### Table: Measurement Data for Samples
| Sample | Hole1 | Hole2 | Hole3 | Hole4 | Hole5 | Mean | Range |
|--------|--------|--------|--------|--------|--------|---------|-------|
| 1 | 205.03 | 205.02 | 205.02 | 205.01 | 205.045| 205.023 | 0.035 |
| 2 | 205.01 | 205.03 | 205.03 | 205.02 | 205.02 | 205.023 | 0.04 |
| 3 | 205.04 | 205.01 | 205.045| 205.04 | 205.01 | 205.029 | 0.03 |
| 4 | 205.03 | 205.02 | 205.03 | 205.035| 205.035| 205.030 | 0.015 |
| 5 | 205.01 | 205.04 | 205.01 | 205.03 | 205.025| 205.023 | 0.03 |
| 6 | 205.025| 205.01 | 205.02 | 205.03 | 205.02 | 205.021 | 0.02 |
| 7 | 205.04 | 205.03 | 205.025| 205.02 | 205.03 | 205.029 | 0.02 |
| 8 | 205.02 | 205.035| 205.02 | 205.04 | 205.02 | 205.027 | 0.02 |
| 9 | 205.03 | 205.03 | 205.02 | 205.025| 205.015| 205.024 | 0.015 |
| 10 | 205.025| 205.02 | 205.045| 205.035| 205.01 | 205.027 | 0.035 |
| 11 | 205.01 | 205

Transcribed Image Text:**Title: Capability Analysis in Automobile Gear Manufacturing**
**Introduction:**
During the manufacturing process of the driver gear of an automobile, precision is crucial. A dial bore gauge is employed to bore a hole into cast steel, ensuring that the diameter is within specified limits.
**Specifications:**
The bore hole diameter must be between 204.05 and 205.05 millimeters, with a targeted mean of 205 millimeters. Meeting these specifications is essential for quality assurance.
**Study Overview:**
A study published in the International Journal of Quality Research (Vol. 8, 2014) conducted a capability analysis to evaluate the boring operation's performance.
**Data Collection:**
- Five driver gear parts were sampled each hour for 20 consecutive hours.
- Bore diameters of these parts were then measured.
**Dataset:**
- The collected data is available in the file named BORE.xlsx.
**Task:**
1. Conduct a complete capability analysis of the data provided.
2. Determine how you would categorize the performance of the boring process.
3. Assess if the process is under control.
4. Calculate the capability index.
5. Plot an X-bar chart to support your evaluation.
**Guidance for Analysis:**
- For calculations such as mean and standard deviation, utilize Excel functions like AVERAGE and STDEV. Adjust for sample size as necessary to ensure accurate results.
**Conclusion:**
Through this exercise, you will learn critical tools for quality control in manufacturing, including how to verify if a process is consistently meeting product specifications and maintaining control.
Expert Solution
Step 1

Step by step
Solved in 2 steps with 2 images

Recommended textbooks for you
MATLAB: An Introduction with Applications
Statistics
ISBN:
9781119256830
Author:
Amos Gilat
Publisher:
John Wiley & Sons Inc

Probability and Statistics for Engineering and th…
Statistics
ISBN:
9781305251809
Author:
Jay L. Devore
Publisher:
Cengage Learning

Statistics for The Behavioral Sciences (MindTap C…
Statistics
ISBN:
9781305504912
Author:
Frederick J Gravetter, Larry B. Wallnau
Publisher:
Cengage Learning
MATLAB: An Introduction with Applications
Statistics
ISBN:
9781119256830
Author:
Amos Gilat
Publisher:
John Wiley & Sons Inc
Probability and Statistics for Engineering and th…
Statistics
ISBN:
9781305251809
Author:
Jay L. Devore
Publisher:
Cengage Learning
Statistics for The Behavioral Sciences (MindTap C…
Statistics
ISBN:
9781305504912
Author:
Frederick J Gravetter, Larry B. Wallnau
Publisher:
Cengage Learning

Elementary Statistics: Picturing the World (7th E…
Statistics
ISBN:
9780134683416
Author:
Ron Larson, Betsy Farber
Publisher:
PEARSON

The Basic Practice of Statistics
Statistics
ISBN:
9781319042578
Author:
David S. Moore, William I. Notz, Michael A. Fligner
Publisher:
W. H. Freeman

Introduction to the Practice of Statistics
Statistics
ISBN:
9781319013387
Author:
David S. Moore, George P. McCabe, Bruce A. Craig
Publisher:
W. H. Freeman