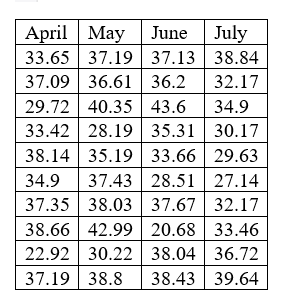
During the days of coronavirus, people work most of the time from home. Many offices, schools, universities conduct their works, meetings, classes online. As a result of this new normal, it is assumed that on average, utility expenses per family (electricity, water, gas etc.) increases by 40% per month. For the verification of this assumption, four months data of percentage change of utility expenses of 10 families of similar size is given below and answer the following questions, the data is normally distributed: Percentage change of utility expenses 33.42 April May 33.65 37.09 29.72 38.14 34.9 37.35 38.66 22.92 34.19 37.19 36.61 40.35 28.19 35.19 37.43 38.03 42.99 38.8 30.22 38.04 36.72 June 37.13 36.2 43.6 35.31 33.66 28.51 37.67 20.68 38.43 July 38.84 32.17 34.9 30.17 29.63 27.14 32.17 33.46 39.64 d. Write your final conclusion about the assumption. e. What will be the 95% confidence interval for the average percentage change of utility expenses on the basis of given data.


Continuous Probability Distributions
Probability distributions are of two types, which are continuous probability distributions and discrete probability distributions. A continuous probability distribution contains an infinite number of values. For example, if time is infinite: you could count from 0 to a trillion seconds, billion seconds, so on indefinitely. A discrete probability distribution consists of only a countable set of possible values.
Normal Distribution
Suppose we had to design a bathroom weighing scale, how would we decide what should be the range of the weighing machine? Would we take the highest recorded human weight in history and use that as the upper limit for our weighing scale? This may not be a great idea as the sensitivity of the scale would get reduced if the range is too large. At the same time, if we keep the upper limit too low, it may not be usable for a large percentage of the population!
Question # 3

Given:

Step by step
Solved in 3 steps with 3 images


