During the days of coronavirus, people work most of the time from home. Many offices, schools, universities conduct their works, meetings, classes online. As a result of this new normal, it is assumed that on average, utility expenses per family (electricity, water, gas etc.) increases by 40% per month. For the verification of this assumption, four months data of percentage change of utility expenses of 10 families of similar size is given below and answer the following questions, the data is normally distributed: Percentage change of utility expenses April 33.65 37.09 29.72 33.42 38.14 34.9 37.35 38.66 22.92 34.19 May 37.19 36.61 40.35 28.19 35.19 37.43 38.03 42.99 30.22 38.8 June 37.13 36.2 43.6 35.31 33.66 28.51 37.67 20.68 38.04 38.43 July 38.84 32.17 34.9 30.17 29.63 27.14 32.17 33.46 36.72 39.64 Which statistical technique(s) will be suitable for testing this assumption? (Only write the name(s) of all possible techniques) b. Write tabulated value of test statistic at 0.05 level of significance Write the null and alternative hypothesis for this test. а. C.
During the days of coronavirus, people work most of the time from home. Many offices, schools, universities conduct their works, meetings, classes online. As a result of this new normal, it is assumed that on average, utility expenses per family (electricity, water, gas etc.) increases by 40% per month. For the verification of this assumption, four months data of percentage change of utility expenses of 10 families of similar size is given below and answer the following questions, the data is normally distributed: Percentage change of utility expenses April 33.65 37.09 29.72 33.42 38.14 34.9 37.35 38.66 22.92 34.19 May 37.19 36.61 40.35 28.19 35.19 37.43 38.03 42.99 30.22 38.8 June 37.13 36.2 43.6 35.31 33.66 28.51 37.67 20.68 38.04 38.43 July 38.84 32.17 34.9 30.17 29.63 27.14 32.17 33.46 36.72 39.64 Which statistical technique(s) will be suitable for testing this assumption? (Only write the name(s) of all possible techniques) b. Write tabulated value of test statistic at 0.05 level of significance Write the null and alternative hypothesis for this test. а. C.

MATLAB: An Introduction with Applications
6th Edition
ISBN:9781119256830
Author:Amos Gilat
Publisher:Amos Gilat
Chapter1: Starting With Matlab
Section: Chapter Questions
Problem 1P

Related questions

Concept explainers
Contingency Table
A contingency table can be defined as the visual representation of the relationship between two or more categorical variables that can be evaluated and registered. It is a categorical version of the scatterplot, which is used to investigate the linear relationship between two variables. A contingency table is indeed a type of frequency distribution table that displays two variables at the same time.
Binomial Distribution
Binomial is an algebraic expression of the sum or the difference of two terms. Before knowing about binomial distribution, we must know about the binomial theorem.
Topic Video
Question

Transcribed Image Text:During the days of coronavirus, people work most of the time from home. Many offices, schools,
universities conduct their works, meetings, classes online. As a result of this new normal, it is
assumed that on average, utility expenses per family (electricity, water, gas etc.) increases by
40% per month. For the verification of this assumption, four months data of percentage change
of utility expenses of 10 families of similar size is given below and answer the following
questions, the data is normally distributed:
Percentage change of utility expenses
April
33.65
37.09
29.72
33.42
38.14
34.9
37.35
38.66
22.92
34.19
May
37.19
36.61
40.35
28.19
35.19
37.43
38.03
42.99
30.22
38.8
June
37.13
36.2
43.6
35.31
33.66
28.51
37.67
20.68
38.04
38.43
July
38.84
32.17
34.9
30.17
29.63
27.14
32.17
33.46
36.72
39.64
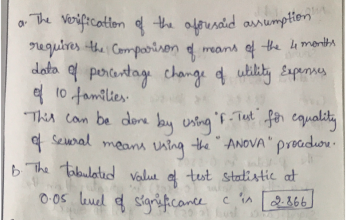
Which statistical technique(s) will be suitable for testing this assumption? (Only write
the name(s) of all possible techniques)
b. Write tabulated value of test statistic at 0.05 level of significance
Write the null and alternative hypothesis for this test.
а.
C.
Expert Solution
Step 1

Step by step
Solved in 2 steps with 2 images

Knowledge Booster


Learn more about
Need a deep-dive on the concept behind this application? Look no further. Learn more about this topic, statistics and related others by exploring similar questions and additional content below.Recommended textbooks for you
MATLAB: An Introduction with Applications
Statistics
ISBN:
9781119256830
Author:
Amos Gilat
Publisher:
John Wiley & Sons Inc

Probability and Statistics for Engineering and th…
Statistics
ISBN:
9781305251809
Author:
Jay L. Devore
Publisher:
Cengage Learning

Statistics for The Behavioral Sciences (MindTap C…
Statistics
ISBN:
9781305504912
Author:
Frederick J Gravetter, Larry B. Wallnau
Publisher:
Cengage Learning
MATLAB: An Introduction with Applications
Statistics
ISBN:
9781119256830
Author:
Amos Gilat
Publisher:
John Wiley & Sons Inc
Probability and Statistics for Engineering and th…
Statistics
ISBN:
9781305251809
Author:
Jay L. Devore
Publisher:
Cengage Learning
Statistics for The Behavioral Sciences (MindTap C…
Statistics
ISBN:
9781305504912
Author:
Frederick J Gravetter, Larry B. Wallnau
Publisher:
Cengage Learning

Elementary Statistics: Picturing the World (7th E…
Statistics
ISBN:
9780134683416
Author:
Ron Larson, Betsy Farber
Publisher:
PEARSON

The Basic Practice of Statistics
Statistics
ISBN:
9781319042578
Author:
David S. Moore, William I. Notz, Michael A. Fligner
Publisher:
W. H. Freeman

Introduction to the Practice of Statistics
Statistics
ISBN:
9781319013387
Author:
David S. Moore, George P. McCabe, Bruce A. Craig
Publisher:
W. H. Freeman