During one month, the rate for renting a particular car model was $65.69 per day plus 25¢ per mile. For a 1-day rental, let x denote the number of miles driven and let y denote the total cost, in dollars. Complete parts (a) through (e) below. a. Find the equation that expresses y in terms of x. y= (Type integers or decimals for any values in the expression. Do not include the $ symbol in your answer. Do not round.) b. Determine bo and b₁. The value of bois. (Type an integer or a decimal. Do not include the $ symbol in your answer. Do not round.) The value of b, is (Type an integer or a decimal. Do not include the $ symbol in your answer. Do not round.) c. Construct a table for the x-values 50, 100, and 250. Miles X 50 100 250 (Simplify your answers. Type integers or decimals. Do not round.) Cost ($) y
During one month, the rate for renting a particular car model was $65.69 per day plus 25¢ per mile. For a 1-day rental, let x denote the number of miles driven and let y denote the total cost, in dollars. Complete parts (a) through (e) below. a. Find the equation that expresses y in terms of x. y= (Type integers or decimals for any values in the expression. Do not include the $ symbol in your answer. Do not round.) b. Determine bo and b₁. The value of bois. (Type an integer or a decimal. Do not include the $ symbol in your answer. Do not round.) The value of b, is (Type an integer or a decimal. Do not include the $ symbol in your answer. Do not round.) c. Construct a table for the x-values 50, 100, and 250. Miles X 50 100 250 (Simplify your answers. Type integers or decimals. Do not round.) Cost ($) y
MATLAB: An Introduction with Applications
6th Edition
ISBN:9781119256830
Author:Amos Gilat
Publisher:Amos Gilat
Chapter1: Starting With Matlab
Section: Chapter Questions
Problem 1P
Related questions
Question

Transcribed Image Text:During one month, the rate for renting a particular car model was $65.69 per day plus 25¢ per mile. For a 1-day rental, let x denote the
number of miles driven and let y denote the total cost, in dollars. Complete parts (a) through (e) below.
a. Find the equation that expresses y in terms of x.
y=
(Type integers or decimals for any values in the expression. Do not include the $ symbol in your answer. Do not round.)
b. Determine bo and b₁.
The value of bo is.
(Type an integer or a decimal. Do not include the $ symbol in your answer. Do not round.)
The value of b₁ is
(Type an integer or a decimal. Do not include the $ symbol in your answer. Do not round.)
c. Construct a table for the x-values 50, 100, and 250.
Cost ($)
y
Miles
X
50
100
250
(Simplify your answers. Type integers or decimals. Do not round.)
d. Draw the graph of the equation in part (a) by plotting the points from part (c) and connecting them with a line. Choose the correct
Expert Solution
This question has been solved!
Explore an expertly crafted, step-by-step solution for a thorough understanding of key concepts.
This is a popular solution!
Trending now
This is a popular solution!
Step by step
Solved in 2 steps

Follow-up Questions
Read through expert solutions to related follow-up questions below.
Follow-up Question

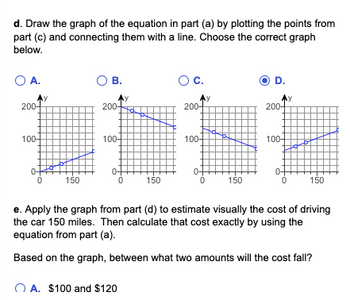
Transcribed Image Text:d. Draw the graph of the equation in part (a) by plotting the points from
part (c) and connecting them with a line. Choose the correct graph
below.
O A.
200+
100-
0
0
y
150
O B.
Ау
200-
100-
A. $100 and $120
0
150
O C.
Ay
200+
100-
0-
0
150
D.
My
200-
100-
0
150
e. Apply the graph from part (d) to estimate visually the cost of driving
the car 150 miles. Then calculate that cost exactly by using the
equation from part (a).
Based on the graph, between what two amounts will the cost fall?
+4
Solution
Recommended textbooks for you

MATLAB: An Introduction with Applications
Statistics
ISBN:
9781119256830
Author:
Amos Gilat
Publisher:
John Wiley & Sons Inc

Probability and Statistics for Engineering and th…
Statistics
ISBN:
9781305251809
Author:
Jay L. Devore
Publisher:
Cengage Learning

Statistics for The Behavioral Sciences (MindTap C…
Statistics
ISBN:
9781305504912
Author:
Frederick J Gravetter, Larry B. Wallnau
Publisher:
Cengage Learning

MATLAB: An Introduction with Applications
Statistics
ISBN:
9781119256830
Author:
Amos Gilat
Publisher:
John Wiley & Sons Inc

Probability and Statistics for Engineering and th…
Statistics
ISBN:
9781305251809
Author:
Jay L. Devore
Publisher:
Cengage Learning

Statistics for The Behavioral Sciences (MindTap C…
Statistics
ISBN:
9781305504912
Author:
Frederick J Gravetter, Larry B. Wallnau
Publisher:
Cengage Learning

Elementary Statistics: Picturing the World (7th E…
Statistics
ISBN:
9780134683416
Author:
Ron Larson, Betsy Farber
Publisher:
PEARSON

The Basic Practice of Statistics
Statistics
ISBN:
9781319042578
Author:
David S. Moore, William I. Notz, Michael A. Fligner
Publisher:
W. H. Freeman

Introduction to the Practice of Statistics
Statistics
ISBN:
9781319013387
Author:
David S. Moore, George P. McCabe, Bruce A. Craig
Publisher:
W. H. Freeman