Draw two figures showing that with a negatively inclined demand Draw two figures showing that with a negatively inclined demand curve and a positively inclined supply curve, producers’ earnings fluctuate more with a shift in demand than with a shift in supply. Draw two figures showing that with a negatively inclined demand


Draw two figures showing that with a negatively inclined demand
Draw two figures showing that with a negatively inclined demand curve and a positively inclined supply curve, producers’ earnings fluctuate more with a shift in demand than with a shift in supply.
Draw two figures showing that with a negatively inclined demand
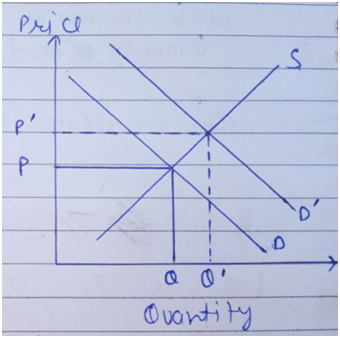
Suppose the negatively inclined demand curve is shown by D and the positively inclined supply curve is shown by S. The equilibrium price is P and quantity is Q. The producers earning is determined through total revenue which is equal to price multiply by quantity.
TR = P*Q
When the demand curve shifts rightwards from D to D’ due to any factor such that increase in consumer preference, increase in consumer income, or decrease and increase in the price of complementary good and substitute good, respectively, both price and quantity changes in the same direction. The price increases to P’ and quantity increases to Q’.
Since both quantity and price increases together, the total revenue increases by a very large amount.

Step by step
Solved in 2 steps with 2 images


