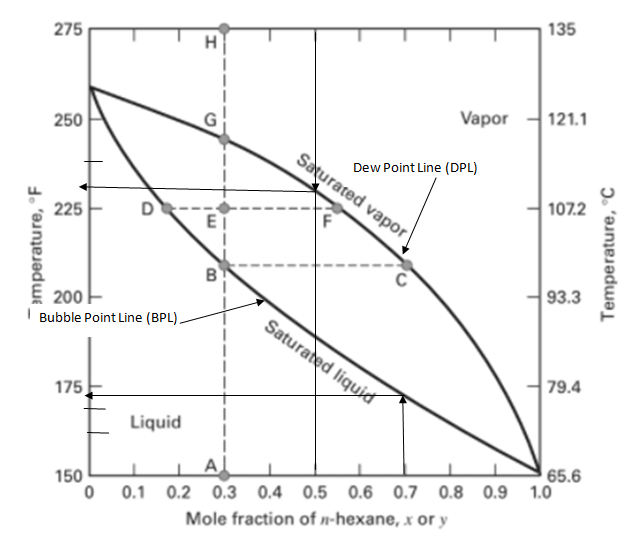
draw something resembling Figure 4.4 is (attached), and indicate the following the bubble point for x = about 0.7, the dew point for y = about 0.5, the locus of saturated liquid compositions, the locus of saturated vapo
draw something resembling Figure 4.4 is (attached), and indicate the following the bubble point for x = about 0.7, the dew point for y = about 0.5, the locus of saturated liquid compositions, the locus of saturated vapo
draw something resembling Figure 4.4 is (attached), and indicate the following the bubble point for x = about 0.7, the dew point for y = about 0.5, the locus of saturated liquid compositions, the locus of saturated vapo
draw something resembling Figure 4.4 is (attached), and indicate the following the bubble point for x = about 0.7, the dew point for y = about 0.5, the locus of saturated liquid compositions, the locus of saturated vapor compositions, the 2-phase region, two tie lines, and the compositions and phase types (L or V) at the ends of these tie lines. Then use the lever arm rule to calculate how many moles of the liquid and vapor at points D and F would results from 100 moles of feed at the composition of point E. Separately, calculate how many moles of liquid at point B would result from 100 moles of the composition at point C being raised from 150F to about 210F (the temperature associated with point C).
Transcribed Image Text:The image presents a \(T-y, x\) phase equilibrium diagram for the n-hexane–n-octane system at 1 atm. The diagram shows temperature plotted on the vertical axis with units in both degrees Fahrenheit (°F) and degrees Celsius (°C). The horizontal axis represents the mole fraction of n-hexane, denoted as \(x\) for liquid phase and \(y\) for vapor phase.
**Explanation of the Diagram:**
- **Curve A-D-B**: This line represents the saturated liquid line. To the left of this line, the system exists predominantly as a liquid phase.
- **Curve A-C-H**: This line depicts the saturated vapor line. To the right of this line, the system exists predominantly as a vapor phase.
- **Region Between the Curves**: This area represents a two-phase region where both liquid and vapor coexist in equilibrium. Points D, E, F, and G inside this region signify equilibrium states between the liquid and vapor phases.
- **Horizontal Tie Lines (e.g., D to F)**: These lines connect compositions of the liquid (x) and vapor (y) phases that coexist at a specific temperature. They indicate how composition changes between the liquid and vapor phases at equilibrium.
- **Vertical Lines (e.g., A to H)**: These lines illustrate constant composition paths where the temperature changes (as demonstrated from point A through H).
- **Temperature Range**: The diagram covers a temperature range from 150°F to 275°F (65.6°C to 135°C).
This diagram is useful in understanding distillation and separation processes involving n-hexane and n-octane, by showing how temperature and composition influence phase behavior at atmospheric pressure.