Distribution of Sunday Skates for 2020/2021 Normal: Mean=12.826, SD=2.9002 Relative Frequency 0.3 0.25 0.2 0.15 01 0.05 10 15 20 Distance


1. Do you think it is reasonable to use the Normal
2. Using your histogram, determine the proportion of Sunday skates with a distance of 10 miles or more. Calculate the correct proportion and show your work for the calculation of the proportion. Round your proportion to four decimal places.

The Normal distribution is also called as the Gaussian distribution. It is the most common distribution that is used.
The Normal distribution has two parameter firstly mean and secondly the standard deviation. It is a continuous probability function. It is usually find in nature.
The probability density function is given as
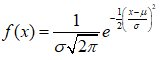
where x is a random variable, μ and σ are the mean and standard deviation respectively.

Step by step
Solved in 2 steps with 1 images


