DIRECTIONS: The table below shows the age t (in years) and the number of hours h slept per day by 24 infants who were less than one year old. Find the LSRL for the data set. Inerpret a and b. Make a prediction for the amount of sleep for an average 9 month old. Make a prediction for the amount of sleep for an average 18 month old. Provide a scatterplot and graph of the LSRL


DIRECTIONS: The table below shows the age t (in years) and the number of hours h slept per day by 24 infants who were less than one year old.
- Find the LSRL for the data set. Inerpret a and b.
- Make a prediction for the amount of sleep for an average 9 month old.
- Make a prediction for the amount of sleep for an average 18 month old.
- Provide a
scatterplot and graph of the LSRL - Interpret the values of the
correlation coefficient and the coefficient of determination.
|
Age (t) |
Sleep (h) |
|
0.03 |
15.0 |
|
0.05 |
15.8 |
|
0.05 |
16.4 |
|
0.08 |
16.2 |
|
0.11 |
14.8 |
|
0.19 |
14.7 |
|
0.21 |
14.5 |
|
0.26 |
15.4 |
|
0.34 |
15.2 |
|
0.35 |
15.3 |
|
0.35 |
14.4 |
|
0.44 |
13.9 |
|
0.52 |
13.9 |
|
0.69 |
13.2 |
|
0.70 |
14.1 |
|
0.75 |
14.2 |
|
0.80 |
13.4 |
|
0.82 |
13.2 |
|
0.86 |
13.9 |
|
0.91 |
13.1 |
|
0.94 |
13.7 |
|
0.97 |
12.7 |
|
0.98 |
13.7 |
|
0.98 |
13.6 |
Hello! As you have posted more than 3 sub parts, we are answering the first 3 sub-parts. In case you require the unanswered parts also, kindly re-post that parts separately.
1.
Least squares regression line(LSRL):
Excel Procedure:
Enter t and h in Excel>Data>Data Analysis> ‘Regression’>Select h under ‘Input Y Range’>Select t under ‘Input X Range’>Click on ‘OK’.
Output:
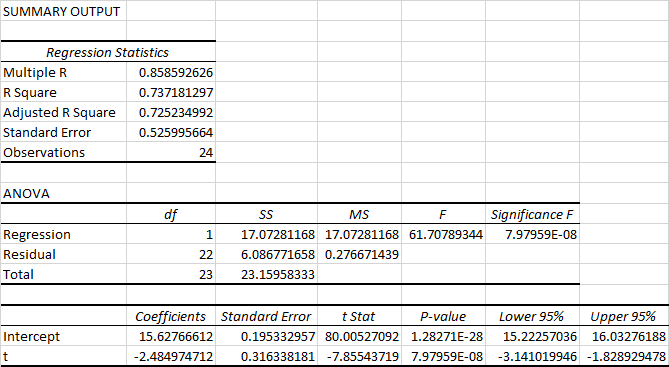
From the given information output,
h=15.6277-2.4850t.
Interpretation:
- Intercept: The constant increase of 15.6277 hours in sleeping hours.
- Slope: There is decrease in sleeping hours by 2.4850 hours as age increases by one year.

Trending now
This is a popular solution!

Step by step
Solved in 2 steps with 1 images


