Data Frequency 60 - 64 1 65 - 69 0 70 - 74 13 75 - 79 14 80 - 84 17 Report mode and median accurate to one decimal place. Report the mean accurate to two decimal places (or enter as a fraction). (a) mode = (b) median = (c) mean = Use the space below to type your answer your work for all the questions in this problem.


| Data | Frequency |
|---|---|
| 60 - 64 | 1 |
| 65 - 69 | 0 |
| 70 - 74 | 13 |
| 75 - 79 | 14 |
| 80 - 84 | 17 |
Report
(a) mode =
(b) median =
(c) mean =
Use the space below to type your answer your work for all the questions in this problem.
Mean: The mean is the sum of observations divided by the number of observations. that is,
Mean =
Notations:
The sample mean = and
Population mean = μ
Median: The median is the value of the middlemost observation in the data set when the observation is arranged in increasing (or decreasing) order of their values.
The formula for median:
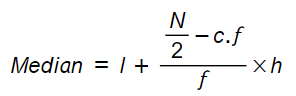
Were,
l: is the lower class boundary of the quartile class.
N: is the total frequency of the distribution
c.f: is the cumulative frequency before the quartile class.
f: is the frequency of the quartile class.
h: is the class size
Mode: The mode is the value that is repeated maximum times.
we can denote it by Mo.
The formula for mode is
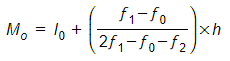
l0 = lower limit of the model class.
h = size of the class interval (assuming all class sizes to be equal).
f1 = frequency of the model class.
f0 = frequency of the class preceding the model class.
f2 = frequency of the class succeeding the model class.

Trending now
This is a popular solution!

Step by step
Solved in 4 steps with 3 images


