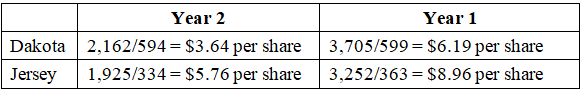
Dakota Inc. and Jersey & Company are two large companies that manufacture and sell equipment used in the construction, mining, agricultural, and forestry industries. The companies reported the following data (in millions) for two recent years: Dakota Jersey Year 2 Year 1 Year 2 Year 1 Net income $2,162 $3,705 $1,925 $3,252 Average number of common shares 594 599 334 363 outstanding a. Determine the earnings per share in Year 2 and Year 1 for each company. Round your answers to two decimal places. Year 2 Year 1 Dakota $ per share 2$ per share Jersey $ per share per share b. Evaluate the relative profitability of the two companies. earnings per share for Year 1 and Year 2 are higher than However, from Year 1 to Year 2, the earnings per share for both companies The slowing world economy contributed to the from Year 1 to Year 2. Overall, appears to be the more profitable company.
Dakota Inc. and Jersey & Company are two large companies that manufacture and sell equipment used in the construction, mining, agricultural, and forestry industries. The companies reported the following data (in millions) for two recent years: Dakota Jersey Year 2 Year 1 Year 2 Year 1 Net income $2,162 $3,705 $1,925 $3,252 Average number of common shares 594 599 334 363 outstanding a. Determine the earnings per share in Year 2 and Year 1 for each company. Round your answers to two decimal places. Year 2 Year 1 Dakota $ per share 2$ per share Jersey $ per share per share b. Evaluate the relative profitability of the two companies. earnings per share for Year 1 and Year 2 are higher than However, from Year 1 to Year 2, the earnings per share for both companies The slowing world economy contributed to the from Year 1 to Year 2. Overall, appears to be the more profitable company.

Chapter1: Financial Statements And Business Decisions
Section: Chapter Questions
Problem 1Q

Related questions
Question
Practice Pack
Hello, I need help solving this. I don't know what to do.
![### Corporate Earnings Analysis: Dakota Inc. vs. Jersey & Company
Dakota Inc. and Jersey & Company are two large companies that manufacture and sell equipment used in the construction, mining, agricultural, and forestry industries. The companies reported the following data (in millions) for two recent years:
#### Financial Data Overview
| | Dakota | Jersey |
|----------|--------|--------|
| | Year 2 | Year 1 | Year 2 | Year 1 |
| **Net Income** | $2,162 | $3,705 | $1,925 | $3,252 |
| **Average Number of Common Shares Outstanding** | 594 | 599 | 334 | 363 |
### Evaluation Criteria
#### a. Determining the Earnings Per Share (EPS)
To determine the earnings per share in Year 2 and Year 1 for each company, use the following formula:
\[ \text{EPS} = \frac{\text{Net Income}}{\text{Average Number of Common Shares Outstanding}} \]
**Year 2 and Year 1 EPS Calculation:**
| Company | Year 2 | Year 1 |
|---------|----------|----------|
| Dakota | $ | $ |
| Jersey | $ | $ |
#### b. Evaluating the Relative Profitability of the Two Companies
Compare the earnings per share for Year 1 and Year 2. Note which company's earnings are higher for each year, and discuss any evident trends.
**Assessment Insights:**
- __ earnings per share for Year 1 and Year 2 are higher than __.
- However, from Year 1 to Year 2, the earnings per share for both companies __.
- The slowing world economy contributed to the __ from Year 1 to Year 2.
- Overall, __ appears to be the more profitable company.
### Interactive Questions for Students:
1. Calculate the earnings per share for both Dakota and Jersey for Year 2 and Year 1.
2. Analyze the trends you've observed from the earnings per share calculations.
3. Discuss how external factors, such as the global economy, might have influenced these companies’ financial performance.
This information provides a comprehensive view to help in understanding the financial health and profitability trends of Dakota Inc. and Jersey & Company over the two years.](/v2/_next/image?url=https%3A%2F%2Fcontent.bartleby.com%2Fqna-images%2Fquestion%2Fe3ab2835-e63c-462d-897e-c9721400fd30%2F87980579-b1a1-46fb-9c2e-89260f898744%2Fkvf3cv9.png&w=3840&q=75)
Transcribed Image Text:### Corporate Earnings Analysis: Dakota Inc. vs. Jersey & Company
Dakota Inc. and Jersey & Company are two large companies that manufacture and sell equipment used in the construction, mining, agricultural, and forestry industries. The companies reported the following data (in millions) for two recent years:
#### Financial Data Overview
| | Dakota | Jersey |
|----------|--------|--------|
| | Year 2 | Year 1 | Year 2 | Year 1 |
| **Net Income** | $2,162 | $3,705 | $1,925 | $3,252 |
| **Average Number of Common Shares Outstanding** | 594 | 599 | 334 | 363 |
### Evaluation Criteria
#### a. Determining the Earnings Per Share (EPS)
To determine the earnings per share in Year 2 and Year 1 for each company, use the following formula:
\[ \text{EPS} = \frac{\text{Net Income}}{\text{Average Number of Common Shares Outstanding}} \]
**Year 2 and Year 1 EPS Calculation:**
| Company | Year 2 | Year 1 |
|---------|----------|----------|
| Dakota | $ | $ |
| Jersey | $ | $ |
#### b. Evaluating the Relative Profitability of the Two Companies
Compare the earnings per share for Year 1 and Year 2. Note which company's earnings are higher for each year, and discuss any evident trends.
**Assessment Insights:**
- __ earnings per share for Year 1 and Year 2 are higher than __.
- However, from Year 1 to Year 2, the earnings per share for both companies __.
- The slowing world economy contributed to the __ from Year 1 to Year 2.
- Overall, __ appears to be the more profitable company.
### Interactive Questions for Students:
1. Calculate the earnings per share for both Dakota and Jersey for Year 2 and Year 1.
2. Analyze the trends you've observed from the earnings per share calculations.
3. Discuss how external factors, such as the global economy, might have influenced these companies’ financial performance.
This information provides a comprehensive view to help in understanding the financial health and profitability trends of Dakota Inc. and Jersey & Company over the two years.
Expert Solution
Step 1
- Calculate earnings per share:

Learn your way
Includes step-by-step video

Step by step
Solved in 2 steps with 2 images

Better your learning with
Practice Pack
Better your learning with
Practice Pack
Knowledge Booster


Learn more about
Need a deep-dive on the concept behind this application? Look no further. Learn more about this topic, accounting and related others by exploring similar questions and additional content below.Recommended textbooks for you

Accounting
Accounting
ISBN:
9781337272094
Author:
WARREN, Carl S., Reeve, James M., Duchac, Jonathan E.
Publisher:
Cengage Learning,

Accounting Information Systems
Accounting
ISBN:
9781337619202
Author:
Hall, James A.
Publisher:
Cengage Learning,
Accounting
Accounting
ISBN:
9781337272094
Author:
WARREN, Carl S., Reeve, James M., Duchac, Jonathan E.
Publisher:
Cengage Learning,
Accounting Information Systems
Accounting
ISBN:
9781337619202
Author:
Hall, James A.
Publisher:
Cengage Learning,

Horngren's Cost Accounting: A Managerial Emphasis…
Accounting
ISBN:
9780134475585
Author:
Srikant M. Datar, Madhav V. Rajan
Publisher:
PEARSON

Intermediate Accounting
Accounting
ISBN:
9781259722660
Author:
J. David Spiceland, Mark W. Nelson, Wayne M Thomas
Publisher:
McGraw-Hill Education

Financial and Managerial Accounting
Accounting
ISBN:
9781259726705
Author:
John J Wild, Ken W. Shaw, Barbara Chiappetta Fundamental Accounting Principles
Publisher:
McGraw-Hill Education