d. What percentage of the variance in the data does the R-squared value explain?

MATLAB: An Introduction with Applications
6th Edition
ISBN:9781119256830
Author:Amos Gilat
Publisher:Amos Gilat
Chapter1: Starting With Matlab
Section: Chapter Questions
Problem 1P

Related questions
Topic Video
Question
Need Assistance with D please

Transcribed Image Text:Palisades Eco-Park is a small ecological reserve that admits a relatively small number of visitors on any day, but provides both
educational and entertaining lectures, exhibitions, and opportunities to observe nature. The company has collected the following data
on labor costs and number of visitors to the park over the last 30 months.
Month
Labor Cost
$26,620
$37,415
$41, 206
$32,628
$35,888
$33,685
$33,015
$39,522
$39,763
$48,387
$43,463
$40, 239
$35,511
$34, 201
$38,117
$27,321
$31,613
$30,889
$28,445
$30,932
$26,488
$25,419
$29,787
$31,087
$28,990
$32,672
$29,539
$30,854
$29,319
$28,738
Visitors
2,500
3,812
4,134
3,267
3,490
3,208
3,243
3,936
4,059
5,252
4,376
4,124
1
2
3
4
6
7
8
10
11
12
3,552
3,436
3,688
3,087
4,995
4,097
3,547
4,371
13
14
15
16
17
18
19
20
2,941
2,639
4,804
5,614
3,812
4,814
4,396
4,485
3,693
3,052
21
22
23
24
25
26
27
28
29
30
Required:
a. Estimate the labor costs assuming 3,300 visitors for the month using the results of a simple regression based on the 30 months of
available data.
b. What percentage of the variance in the data does the R-squared value explain?
c. You learn that starting in month 16, the park started using a different, more automated system for interacting with visitors. Estimate
the labor cost assuming 3,300 visitors using the results of a simple regression based on the data for months 16 through 30 only.
d. What percentage of the variance in the data does the R-squared value explain?
Complete this question by entering your answers in the tabs below.
Expert Solution
Step 1 Introduction
The R squared value is known as coefficient of determination and it is defined as the square of the correlation coefficient (r) value.
The formula for correlation coefficient r formula is
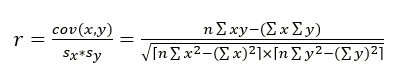
Coefficient of determination r2 tells us how much percentage of variance in y variable explained by the variance in x variable.

Step by step
Solved in 2 steps with 2 images

Knowledge Booster


Learn more about
Need a deep-dive on the concept behind this application? Look no further. Learn more about this topic, statistics and related others by exploring similar questions and additional content below.Recommended textbooks for you
MATLAB: An Introduction with Applications
Statistics
ISBN:
9781119256830
Author:
Amos Gilat
Publisher:
John Wiley & Sons Inc

Probability and Statistics for Engineering and th…
Statistics
ISBN:
9781305251809
Author:
Jay L. Devore
Publisher:
Cengage Learning

Statistics for The Behavioral Sciences (MindTap C…
Statistics
ISBN:
9781305504912
Author:
Frederick J Gravetter, Larry B. Wallnau
Publisher:
Cengage Learning
MATLAB: An Introduction with Applications
Statistics
ISBN:
9781119256830
Author:
Amos Gilat
Publisher:
John Wiley & Sons Inc
Probability and Statistics for Engineering and th…
Statistics
ISBN:
9781305251809
Author:
Jay L. Devore
Publisher:
Cengage Learning
Statistics for The Behavioral Sciences (MindTap C…
Statistics
ISBN:
9781305504912
Author:
Frederick J Gravetter, Larry B. Wallnau
Publisher:
Cengage Learning

Elementary Statistics: Picturing the World (7th E…
Statistics
ISBN:
9780134683416
Author:
Ron Larson, Betsy Farber
Publisher:
PEARSON

The Basic Practice of Statistics
Statistics
ISBN:
9781319042578
Author:
David S. Moore, William I. Notz, Michael A. Fligner
Publisher:
W. H. Freeman

Introduction to the Practice of Statistics
Statistics
ISBN:
9781319013387
Author:
David S. Moore, George P. McCabe, Bruce A. Craig
Publisher:
W. H. Freeman