d. The p-value = (Please show your answer to 4 decimal places.) e. The p-value is ? v a f. Based on this, we should Select an answer v the null hypothesis. g. Thus, the final conclusion is that ...
d. The p-value = (Please show your answer to 4 decimal places.) e. The p-value is ? v a f. Based on this, we should Select an answer v the null hypothesis. g. Thus, the final conclusion is that ...

MATLAB: An Introduction with Applications
6th Edition
ISBN:9781119256830
Author:Amos Gilat
Publisher:Amos Gilat
Chapter1: Starting With Matlab
Section: Chapter Questions
Problem 1P

Related questions
Topic Video
Question
Please help with D E F
Please Help with D E F

Transcribed Image Text:Before the furniture store began its ad campaign, it averaged 130 customers per day. The manager is
investigating if the average is smaller since the ad came out. The data for the 16 randomly selected days
since the ad campaign began is shown below:
109, 117, 133, 117, 134, 129, 110, 136, 110, 128, 113, 138, 125, 99, 145, 114
Assuming that the distribution is normal, what can be concluded at the a = 0.10 level of significance?
a. For this study, we should use Select an answer
b. The null and alternative hypotheses would be:
Но:
? v
Select an answer v
H1:
Select an answer v
c. The test statistic
(please show your answer to 3 decimal places.)
%3D
d. The p-value =
(Please show your answer to 4 decimal places.)
e. The p-value is ? v a
f. Based on this, we should Select an answer v the null hypothesis.
g. Thus, the final conclusion is that ...
O The data suggest that the population mean number of customers since the ad campaign began
is not significantly less than 130 at a = 0.10, so there is insufficient evidence to conclude that
the population mean number of customers since the ad campaign began is less than 130.
O The data suggest the populaton mean is significantly less than 130 at a = 0.10, so there is
sufficient evidence to conclude that the population mean number of customers since the ad
campaign began is less than 130.
O The data suggest the population mean is not significantly less than 130 at a = 0.10, so there is
sufficient evidence to conclude that the population mean number of customers since the ad
campaign began is equal to 130.
Expert Solution
Step 1
d.
The descriptive statistics is conducted using EXCEL. The software procedure is given below:
- Enter the data.
- Select Data > Data Analysis >Descriptive Statistics> OK.
- Enter Input Range as Data column.
- Mark Labels in First Row.
- Mark Summary Statistics.
- Click OK.
The output using EXCEL is as follows:
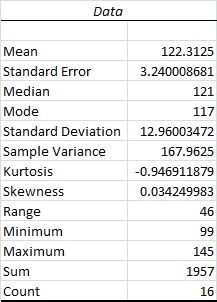
From the output, the mean is 122.3125, and the standard deviation is 12.9600.
The test statistic is,
The test statistic is -2.373.
The degrees of freedom is,
The degrees of freedom is 15.
The hypothesis is left tail. The probability of t less than –2.373 with 15 degrees of freedom can be obtained using the excel formula “=T.DIST(–2.373,15,TRUE)”.The probability value is 0.0157.
Thus, the p-value is 0.0157.

Step by step
Solved in 2 steps with 1 images

Knowledge Booster


Learn more about
Need a deep-dive on the concept behind this application? Look no further. Learn more about this topic, statistics and related others by exploring similar questions and additional content below.Recommended textbooks for you
MATLAB: An Introduction with Applications
Statistics
ISBN:
9781119256830
Author:
Amos Gilat
Publisher:
John Wiley & Sons Inc

Probability and Statistics for Engineering and th…
Statistics
ISBN:
9781305251809
Author:
Jay L. Devore
Publisher:
Cengage Learning

Statistics for The Behavioral Sciences (MindTap C…
Statistics
ISBN:
9781305504912
Author:
Frederick J Gravetter, Larry B. Wallnau
Publisher:
Cengage Learning
MATLAB: An Introduction with Applications
Statistics
ISBN:
9781119256830
Author:
Amos Gilat
Publisher:
John Wiley & Sons Inc
Probability and Statistics for Engineering and th…
Statistics
ISBN:
9781305251809
Author:
Jay L. Devore
Publisher:
Cengage Learning
Statistics for The Behavioral Sciences (MindTap C…
Statistics
ISBN:
9781305504912
Author:
Frederick J Gravetter, Larry B. Wallnau
Publisher:
Cengage Learning

Elementary Statistics: Picturing the World (7th E…
Statistics
ISBN:
9780134683416
Author:
Ron Larson, Betsy Farber
Publisher:
PEARSON

The Basic Practice of Statistics
Statistics
ISBN:
9781319042578
Author:
David S. Moore, William I. Notz, Michael A. Fligner
Publisher:
W. H. Freeman

Introduction to the Practice of Statistics
Statistics
ISBN:
9781319013387
Author:
David S. Moore, George P. McCabe, Bruce A. Craig
Publisher:
W. H. Freeman