d. Compare the F tabulated value [associates the F test in part (b)] with the value of t²n-2,1-a/2 where tn-2,1-a/2 is the suitable tabulated value in part (c).
d. Compare the F tabulated value [associates the F test in part (b)] with the value of t²n-2,1-a/2 where tn-2,1-a/2 is the suitable tabulated value in part (c).

MATLAB: An Introduction with Applications
6th Edition
ISBN:9781119256830
Author:Amos Gilat
Publisher:Amos Gilat
Chapter1: Starting With Matlab
Section: Chapter Questions
Problem 1P

Related questions
Question
Part d only
![d. (Blurred text) Compare the \( F \) tabulated value [associates the \( F \) test in part (b)] with the value of \( t^2_{n-2, 1-\alpha/2} \) where \( t_{n-2, 1-\alpha/2} \) is the suitable tabulated value in part (c).](/v2/_next/image?url=https%3A%2F%2Fcontent.bartleby.com%2Fqna-images%2Fquestion%2F763773a4-b59e-428b-8a3f-bc3dd5fb97d6%2F42baae5a-4d76-47dc-b059-b76b5b5e07d3%2F9zlngja_processed.png&w=3840&q=75)
Transcribed Image Text:d. (Blurred text) Compare the \( F \) tabulated value [associates the \( F \) test in part (b)] with the value of \( t^2_{n-2, 1-\alpha/2} \) where \( t_{n-2, 1-\alpha/2} \) is the suitable tabulated value in part (c).

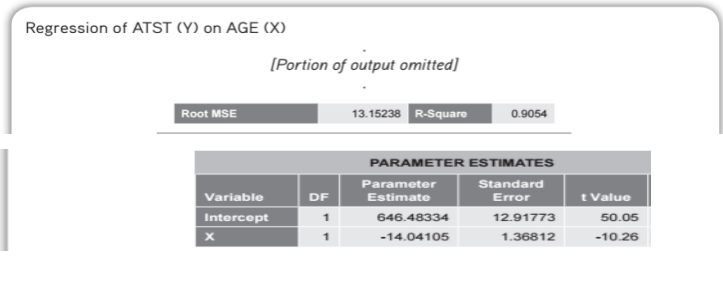
Transcribed Image Text:**Edited SAS Output (PROC REG) for Problem 6**
### Regression of ATST (Y) on AGE (X)
- **Root MSE**: 13.15238
- **R-Square**: 0.9054
### Parameter Estimates
| Variable | DF | Parameter Estimate | Standard Error | t Value |
|-----------|----|--------------------|----------------|----------|
| Intercept | 1 | 646.48334 | 12.91773 | 50.05 |
| X | 1 | -14.04105 | 1.36812 | -10.26 |
---
**Assumptions:**
- \( n = 13 \)
- \( S^2_{y|x} = 172.985 \)
- \( SSY = 20,123.382 \)
a. Construct the ANOVA table for regression of ATST on AGE.
Expert Solution
Step 1
Given the result of regression as
, and

Step by step
Solved in 2 steps with 1 images

Recommended textbooks for you
MATLAB: An Introduction with Applications
Statistics
ISBN:
9781119256830
Author:
Amos Gilat
Publisher:
John Wiley & Sons Inc

Probability and Statistics for Engineering and th…
Statistics
ISBN:
9781305251809
Author:
Jay L. Devore
Publisher:
Cengage Learning

Statistics for The Behavioral Sciences (MindTap C…
Statistics
ISBN:
9781305504912
Author:
Frederick J Gravetter, Larry B. Wallnau
Publisher:
Cengage Learning
MATLAB: An Introduction with Applications
Statistics
ISBN:
9781119256830
Author:
Amos Gilat
Publisher:
John Wiley & Sons Inc
Probability and Statistics for Engineering and th…
Statistics
ISBN:
9781305251809
Author:
Jay L. Devore
Publisher:
Cengage Learning
Statistics for The Behavioral Sciences (MindTap C…
Statistics
ISBN:
9781305504912
Author:
Frederick J Gravetter, Larry B. Wallnau
Publisher:
Cengage Learning

Elementary Statistics: Picturing the World (7th E…
Statistics
ISBN:
9780134683416
Author:
Ron Larson, Betsy Farber
Publisher:
PEARSON

The Basic Practice of Statistics
Statistics
ISBN:
9781319042578
Author:
David S. Moore, William I. Notz, Michael A. Fligner
Publisher:
W. H. Freeman

Introduction to the Practice of Statistics
Statistics
ISBN:
9781319013387
Author:
David S. Moore, George P. McCabe, Bruce A. Craig
Publisher:
W. H. Freeman