CV, = Select an answer v CV2 = Select an answer v %3D Round to Two Decimal Places CV, = CV2 = f) What formula will we use for the test value? p – p Oz = V (71 – F2) – (µ1 – H2) Ot = n1 (P1 – P2) – (Pi – p2) Oz = | n1 n2 Ot = Oz =


Unitary Method
The word “unitary” comes from the word “unit”, which means a single and complete entity. In this method, we find the value of a unit product from the given number of products, and then we solve for the other number of products.
Speed, Time, and Distance
Imagine you and 3 of your friends are planning to go to the playground at 6 in the evening. Your house is one mile away from the playground and one of your friends named Jim must start at 5 pm to reach the playground by walk. The other two friends are 3 miles away.
Profit and Loss
The amount earned or lost on the sale of one or more items is referred to as the profit or loss on that item.
Units and Measurements
Measurements and comparisons are the foundation of science and engineering. We, therefore, need rules that tell us how things are measured and compared. For these measurements and comparisons, we perform certain experiments, and we will need the experiments to set up the devices.
![**Hypothesis Testing Example: Miniature Golf Scores**
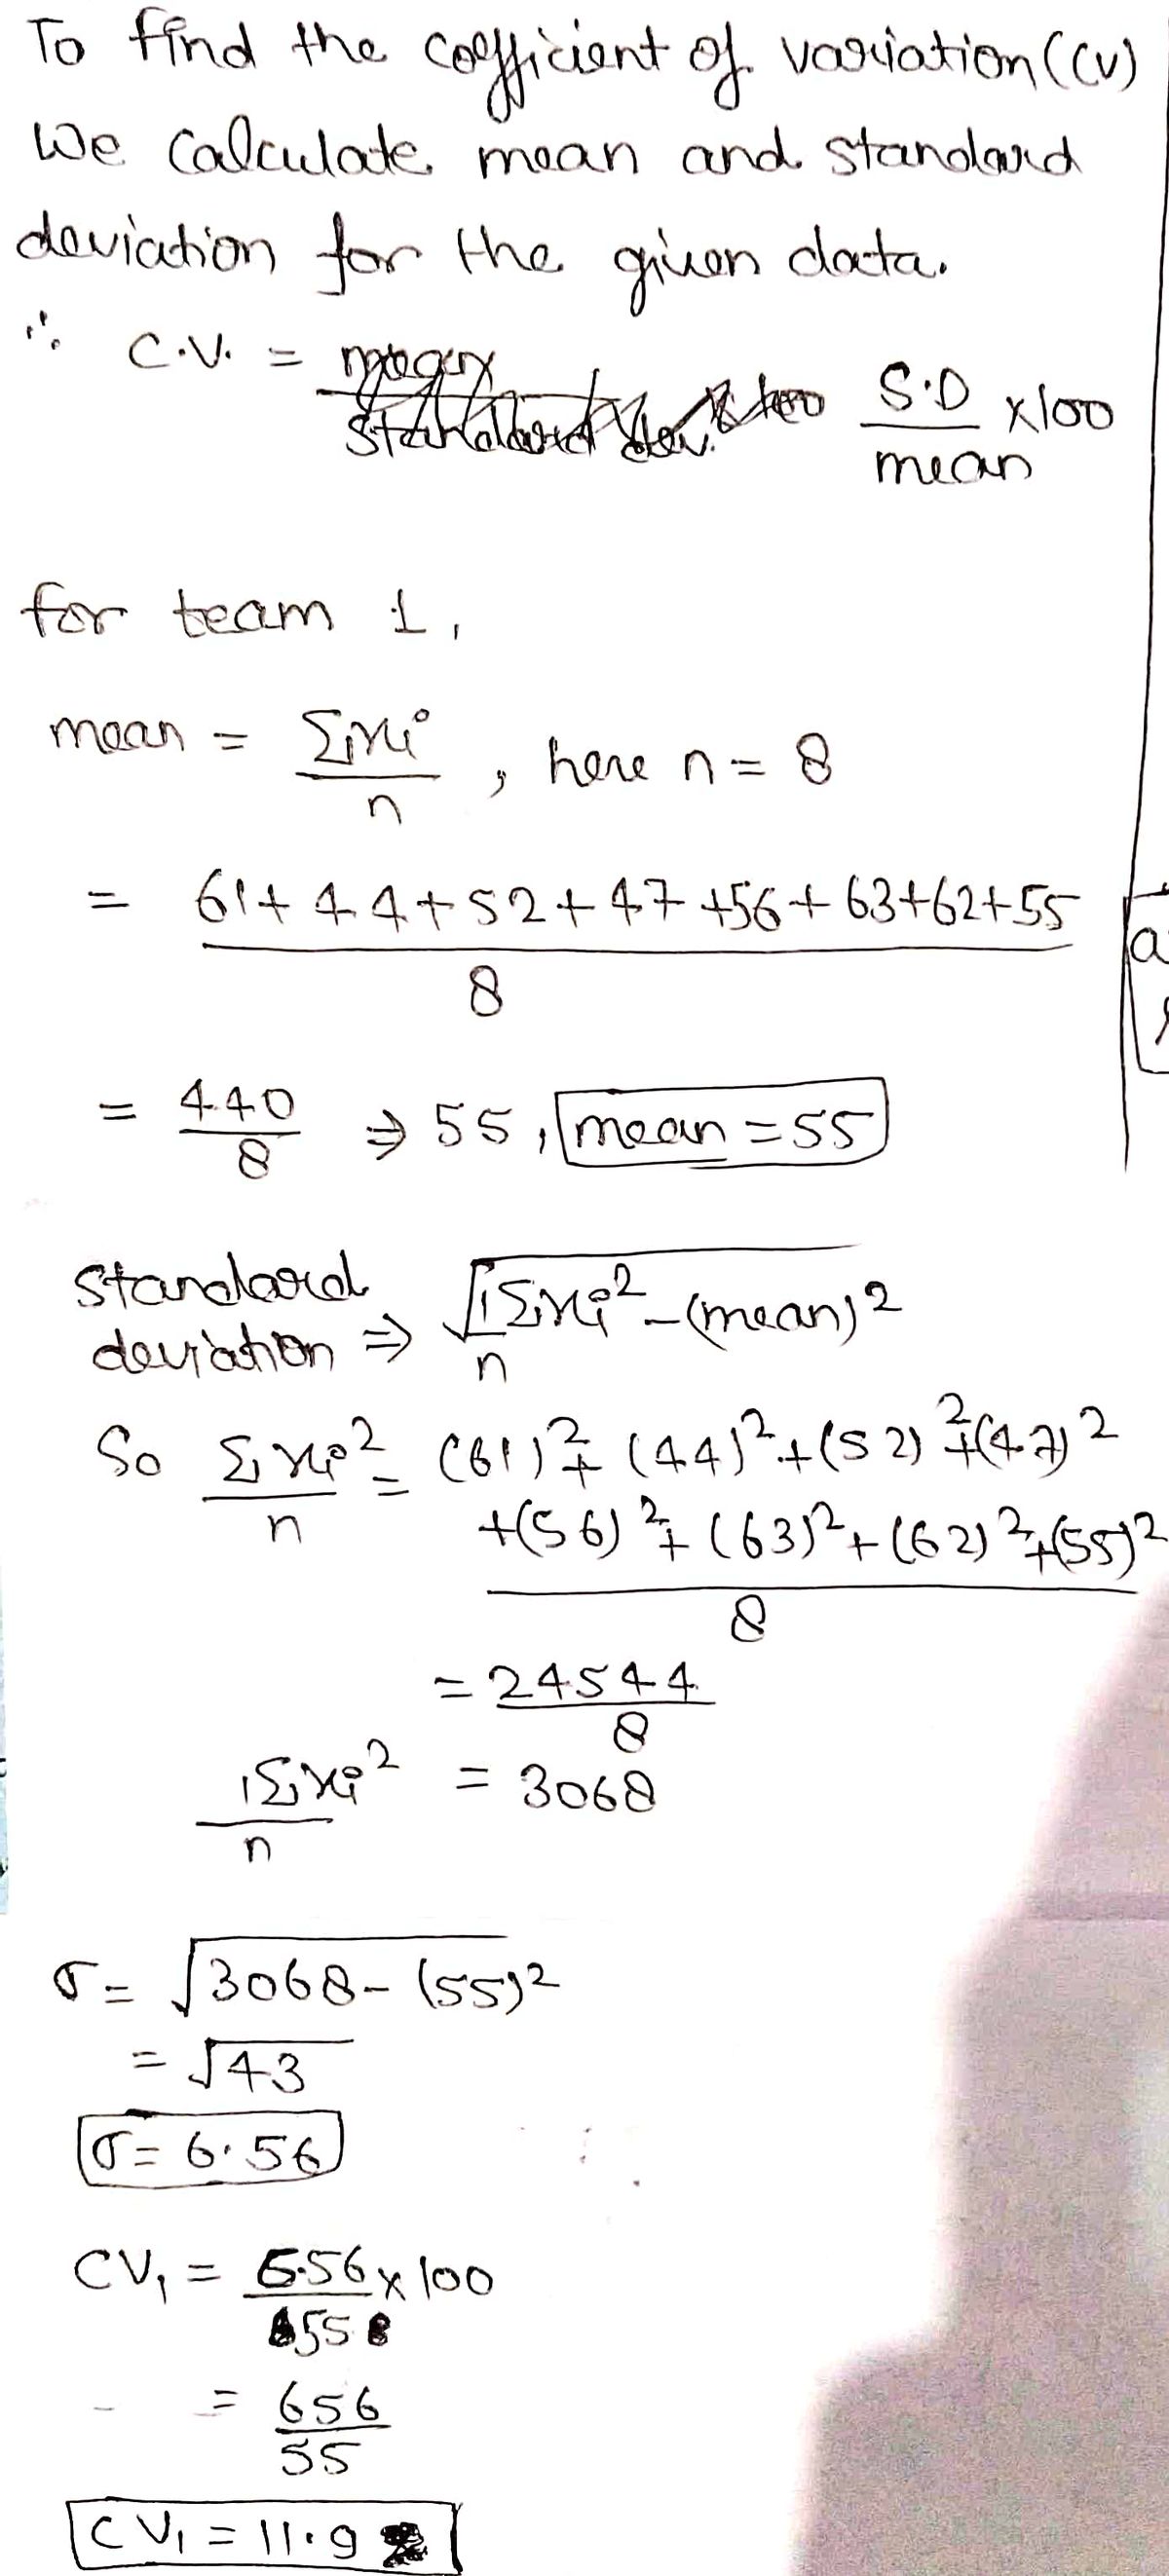
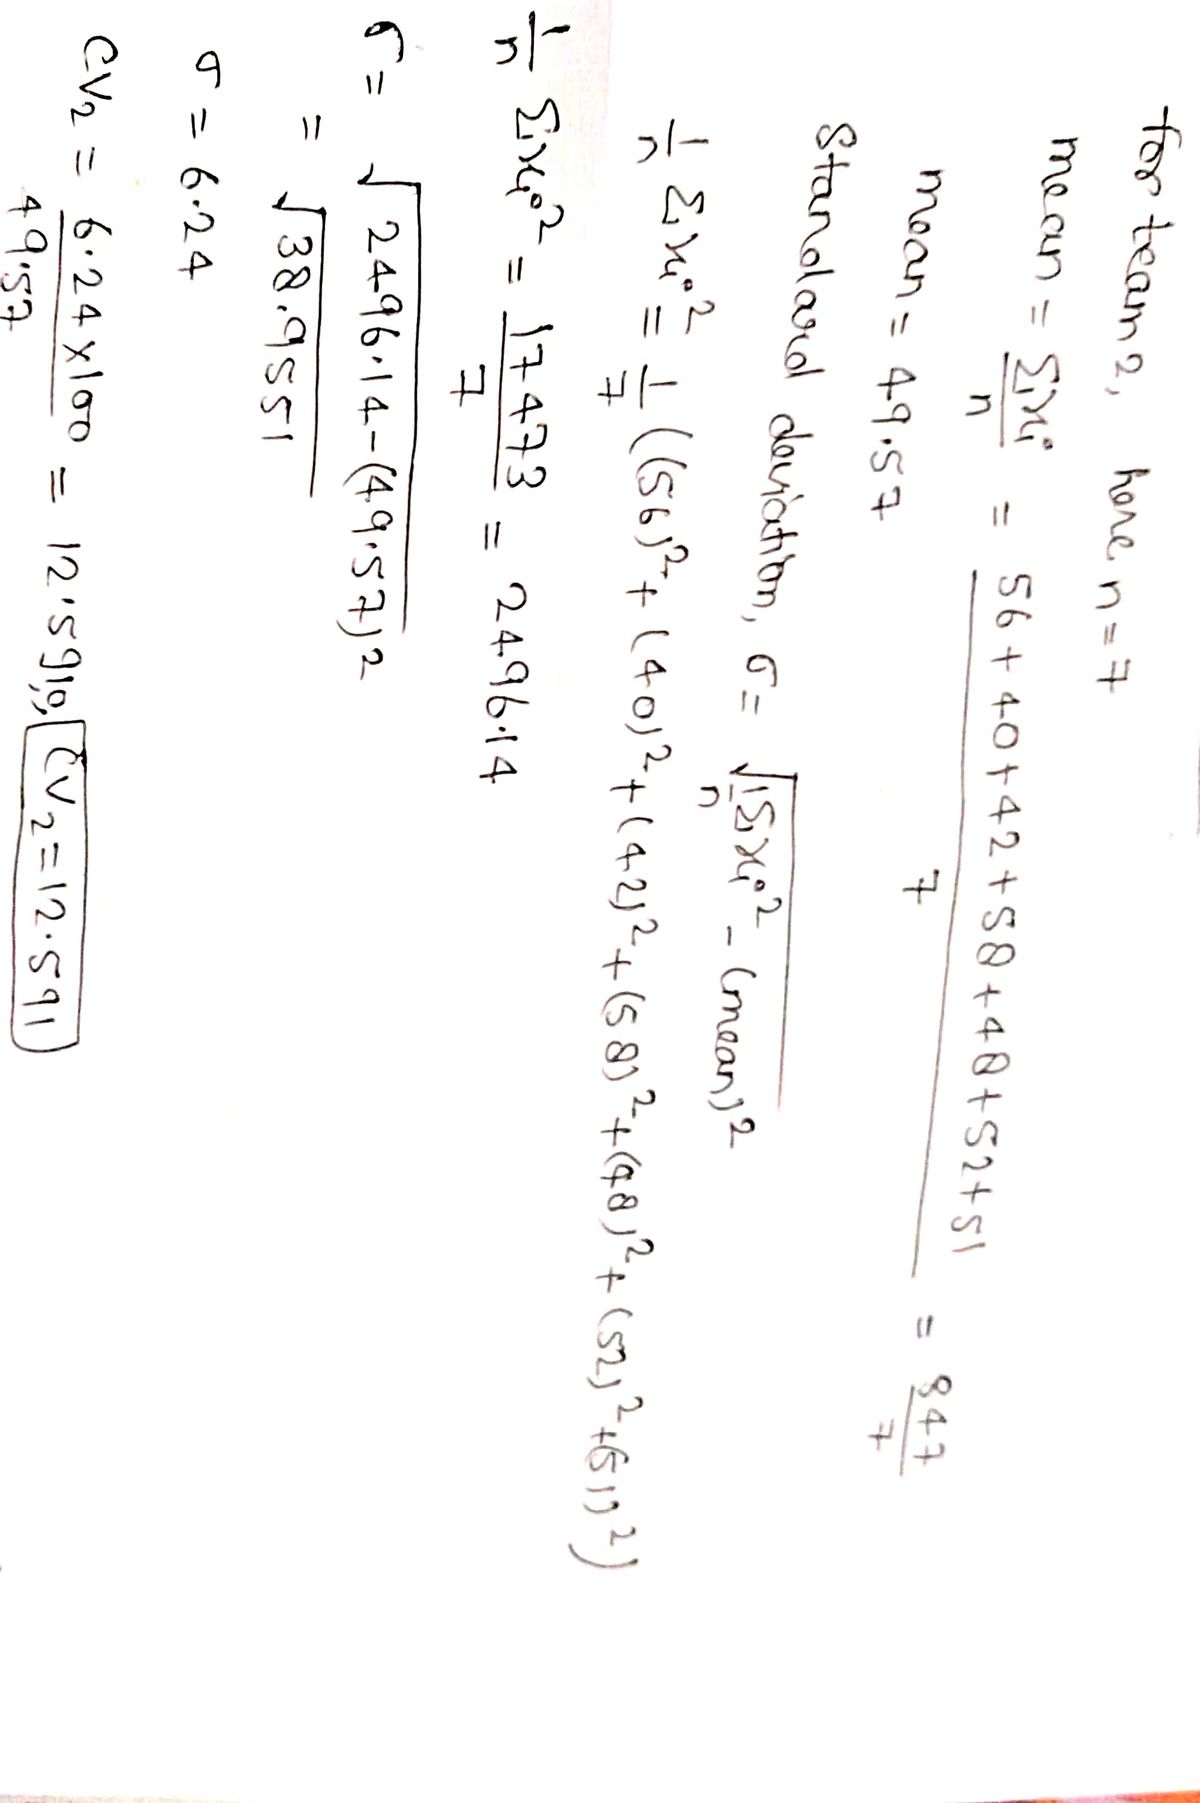
A large group of friends went miniature golfing together at a golf course and decided to play on two teams. A random sample of scores from each of the two teams is shown below.
At \( \alpha = 0.05 \), is there enough evidence to conclude there is a difference in mean scores between the two teams?
| | |
|-------|-------|
| **Team 1** | 61, 44, 52, 47, 56, 63, 62, 55 |
| **Team 2** | 56, 40, 42, 58, 48, 52, 51 |
---
**a) Based on reading the problem, how do we know we are working with a hypotheses test (\( H_0 \) and \( H_1 \))? This question has two possible answers.**
- [ ] Asks us to find (estimate) the % confidence interval of the population (true) mean.
- [ ] Asks us to find the sample size (how many or how large).
- [x] \( \alpha \) is provided.
- [ ] Asks us to find (estimate) the % confidence interval of the population (true) proportion.
- [x] Asks if there is evidence or can we conclude something.
---
**Hypotheses**
- \( H_0: \mu_1 - \mu_2 = 0 \) (Not the claim)
- \( H_1: \mu_1 - \mu_2 \neq 0 \) (Claim)
---
These questions and setup are designed to guide students through understanding hypothesis testing by identifying key information, such as the significance level \( \alpha \) and whether the problem is asking for comparative conclusions based on statistical evidence.](/v2/_next/image?url=https%3A%2F%2Fcontent.bartleby.com%2Fqna-images%2Fquestion%2Faa466c24-bbae-451a-a078-10dcd226e22a%2F30dd3b59-bb40-4af5-905f-d319ea1709dd%2Fx1lkyg8o_processed.jpeg&w=3840&q=75)
![## Educational Website Content
### Critical Values and Test Formulas
**Select the Critical Values (CV):**
- **CV1 =** [Select an answer] \( \left( \_\_\_ , \_\_\_ \right) \)
- **CV2 =** [Select an answer] \( \left( \_\_\_ , \_\_\_ \right) \)
### Round to Two Decimal Places:
- **CV1 =** [Input Box]
- **CV2 =** [Input Box]
---
### Test Value Formula Selection:
**f) What formula will we use for the test value?**
1. \( z = \frac{\hat{p} - p}{\sqrt{\frac{p \cdot q}{n}}} \)
2. \( z = \frac{(\bar{x}_1 - \bar{x}_2) - (\mu_1 - \mu_2)}{\sqrt{\frac{s_1^2}{n_1} + \frac{s_2^2}{n_2}}} \)
3. \( z = \frac{(\hat{p}_1 - \hat{p}_2) - (p_1 - p_2)}{\sqrt{\hat{p} \cdot \hat{q} \cdot \left( \frac{1}{n_1} + \frac{1}{n_2} \right)}} \)
4. \( t = \frac{\bar{x} - \mu}{\frac{s}{\sqrt{n}}} \)
5. \( z = \frac{\bar{x} - \mu}{\frac{\sigma}{\sqrt{n}}} \)
### Description
This section guides you on how to select and calculate critical values and test value formulas. The formulas presented include both \( z \)-scores and \( t \)-scores for hypothesis testing under various conditions, such as comparing population proportions or means.](/v2/_next/image?url=https%3A%2F%2Fcontent.bartleby.com%2Fqna-images%2Fquestion%2Faa466c24-bbae-451a-a078-10dcd226e22a%2F30dd3b59-bb40-4af5-905f-d319ea1709dd%2Fo783rnd_processed.jpeg&w=3840&q=75)

Step by step
Solved in 3 steps with 2 images


