Current assets Cash and cash equivalents Trade and other receivables Inventories Other financial assets Other current assets Assets held for sale Total current assets Non-current assets Trade and other receivables Other financial assets Lease assets Property, plant and equipment Intangible assets Deferred tax assets Other non-current assets Total non-current assets Total assets Current liabilities Trade and other payables Lease liabilities Borrowings Current tax payable Other financial liabilities Provisions Total current liabilities Non-current liabilities Lease liabilities Borrowings Other financial liabilities Deferred tax liabilities Provisions Other non-current liabilities Total non-current liabilities Total liabilities Net assets Equity Contributed equity Reserves Retained earnings Equity attributable to equity holders of the parent entity Non-controlling interests Total equity NOTE 3.1 3.2 5.2 3.1 3.2 3.3.1 3.4 3.5 3.7.3 3.8 3.3.2 4.6.3 3.2 3.9 3.3.2 4.6.3 3.2 3.7.3 3.9 3.10 4.3 4.4 5.3.3 2020 SM 2,068 740 4,434 534 16 7,792 333 8,125 154 168 12,062 8,742 7,717 1,327 177 30,347 38,472 7,508 1,560 2,027 131 84 1,881 13,191 13,168 1,904 3 204 918 52 16,249 29,440 9,032 6,022 391 2,329 8,742 290 9,032 RESTATED 2019 SM 1,066 682 4,280 45 6,073 225 6,298 145 633 8,252 7,793 736 59 17,618 23,916 6,676 274 84 58 1,793 8,885 2,855 24 345 986 337 4,547 13,432 10,484 5,828 490 3,783 10,101 383 10,484
Calculate the ratios of Woolworths Group (Australian retail company) for the year 2020:
Ratios to calculate:
Profitability (ROSF, ROCE, Gross margin, Operating profit margin, Cash flow to Sales*)
Efficiency (Inventory turnover period, Average settlement period, Sales revenue to capital employed)
Stability/Capital Structure (Gearing ratio, Interest cover ratio, Debt coverage ratio*)
Investment/Market Performance (Earnings per share, Price earnings ratio, Operating cash flow per share*)


Financial ratios measures the relationship between two or more components of the financial statements of a company. These help in managerial decision making. Some key financial ratios are :-
- Liquidity Ratio
- Profitability Ratio
- Solvency Ratio
- Activity Ratio
- Earnings Ratio
Step by step
Solved in 3 steps with 2 images

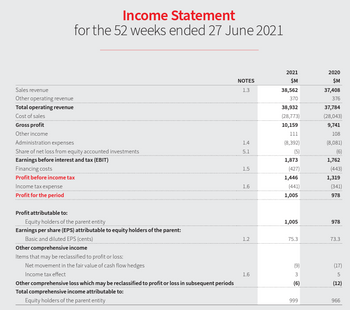
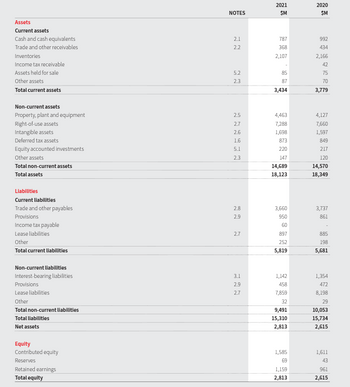
Calculate the ratios of Coles group of Australia for the year 2021:
Ratios to calculate:
Profitability (ROSF, ROCE, Gross margin, Operating profit margin,
Efficiency (Inventory turnover period, Average settlement period, Sales revenue to capital employed)
Stability/Capital Structure (Gearing ratio, Interest cover ratio, Debt coverage ratio*)
Investment/Market Performance (Earnings per share, Price earnings ratio, Operating cash flow per share*)


