Storing tabular data as pandas dataframe: Data preprocessing is one of the steps in machine learning. The pandas library in python is suitable to deal with tabular data. Create a variable ‘emissions’ and assign to it the following data (Table 1) as padas DataFrame. Create an excel file ‘emissions_from_pandas.xlsx’ from the ‘emissions’ variable using python. Table 1. Particulate matter (PM) emissions (in g/gal) for 15 vehicles driven at low altitude and another 15 vehicles driven at high altitude. Low Altitude High Altitude 1.50 7.59 1.48 2.06 2.98 8.86 1.40 8.67 3.12 5.61 0.25 6.28 6.73 4.04 5.30 4.40 9.30 9.52 6.96 1.50 7.21 6.07 0.87 17.11 1.06 3.57 7.39 2.68 1.37 6.46 iloc[] method: (b) Using the .iloc[] method, we can access any part of the dataframe. Run the following commands and show the outputs: emissions.head() emissions.iloc[0,0] emissions.iloc[1,1] emissions.iloc[0:2,0:2] emissions.iloc[2:4,:]
Storing tabular data as pandas dataframe:
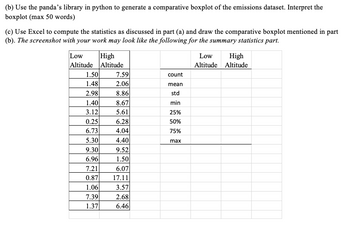
(a) Data preprocessing is one of the steps in machine learning. The pandas library in python is suitable to deal with tabular data. Create a variable ‘emissions’ and assign to it the following data (Table 1) as padas DataFrame. Create an excel file ‘emissions_from_pandas.xlsx’ from the ‘emissions’ variable using python.
Table 1. Particulate matter (PM) emissions (in g/gal) for 15 vehicles driven at low altitude and another 15 vehicles driven at high altitude.
|
Low Altitude |
High Altitude |
|
1.50 |
7.59 |
|
1.48 |
2.06 |
|
2.98 |
8.86 |
|
1.40 |
8.67 |
|
3.12 |
5.61 |
|
0.25 |
6.28 |
|
6.73 |
4.04 |
|
5.30 |
4.40 |
|
9.30 |
9.52 |
|
6.96 |
1.50 |
|
7.21 |
6.07 |
|
0.87 |
17.11 |
|
1.06 |
3.57 |
|
7.39 |
2.68 |
|
1.37 |
6.46 |
iloc[] method:
(b) Using the .iloc[] method, we can access any part of the dataframe. Run the following commands and show the outputs:
emissions.head()
emissions.iloc[0,0]
emissions.iloc[1,1]
emissions.iloc[0:2,0:2]
emissions.iloc[2:4,:]
Step by step
Solved in 8 steps with 7 images


File conversion:
(c) Create an xl file "emissions_from_pandas.xlsx" from the emissions variable using the .to_excel method. Paste the screenshot of the input command.
(d) Create an MS Excel file ‘emissions_excel.xlsx’ containing the data in Table 1 above with the column header and save it on your computer. Create a variable ‘emissions_from_excel’ from the ‘emissions_excel.xlsx’ file using pd_read function. Show the first five rows using .head(). Paste a screenshot with the input commands used.


