Could you help me calculate r? Also could you demonstrate how to find the critical

MATLAB: An Introduction with Applications
6th Edition
ISBN:9781119256830
Author:Amos Gilat
Publisher:Amos Gilat
Chapter1: Starting With Matlab
Section: Chapter Questions
Problem 1P

Related questions
Question
Could you help me calculate r? Also could you demonstrate how to find the critical value?

Transcribed Image Text:The accompanying table shows the eamings per share (in dollars) and the dividends per share (in dollars) for 6 companies
in a recent year. Complete parts (a) through (d) below.
Click here to view the data table. Click here to view the table of critical values for the Pearson correlation coefficient.
(a) Display the data in a scatter plot. Choose the correct graph below.
O A.
OB.
Dividende pershare ($)
6
3
0
1
2 3
0
Dividends pershare (4)
0
1
2
(b) Calculate the sample correlation coefficient r
r= 0.065
(Round to three decimal places as needed.)
Q
(4) lys led spueping
a.
10
2015 DE
9
Q
WOOLING
✔D.
(t) ajaye led spuoping
HA
SALLE DE DIETA
0
TOGE
9
E

Transcribed Image Text:Click here to view the dal table. Click here to view the table of critical values fo
(c) Describe the type of correlation, if any, and interpret the correlation in the co
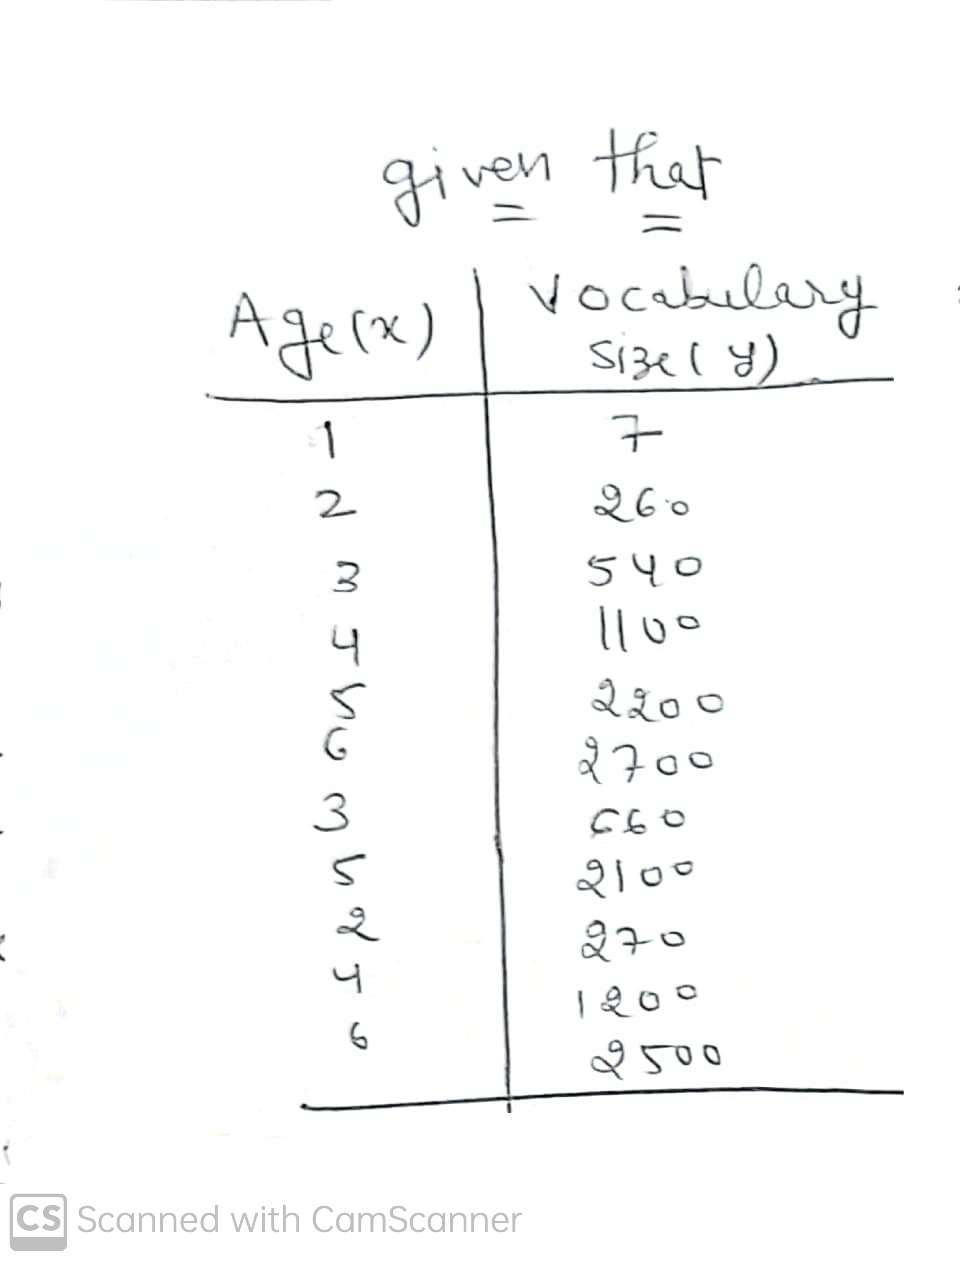
Data Table
Age, x
1
2
3
4
5
6
3
LO N † (0)
5
2
4
6
Print
Vocabulary size, y 9
7
260
07
Damaul
540
1100
2200
2700
660
2100
270
1200
2500
Done
X
hip
CD
1%
Expert Solution
Step 1
Given that
We have to find
a...Scatter plot
b...sample correlation coefficient
c... critical value of correlation

Step by step
Solved in 4 steps with 4 images

Recommended textbooks for you
MATLAB: An Introduction with Applications
Statistics
ISBN:
9781119256830
Author:
Amos Gilat
Publisher:
John Wiley & Sons Inc

Probability and Statistics for Engineering and th…
Statistics
ISBN:
9781305251809
Author:
Jay L. Devore
Publisher:
Cengage Learning

Statistics for The Behavioral Sciences (MindTap C…
Statistics
ISBN:
9781305504912
Author:
Frederick J Gravetter, Larry B. Wallnau
Publisher:
Cengage Learning
MATLAB: An Introduction with Applications
Statistics
ISBN:
9781119256830
Author:
Amos Gilat
Publisher:
John Wiley & Sons Inc
Probability and Statistics for Engineering and th…
Statistics
ISBN:
9781305251809
Author:
Jay L. Devore
Publisher:
Cengage Learning
Statistics for The Behavioral Sciences (MindTap C…
Statistics
ISBN:
9781305504912
Author:
Frederick J Gravetter, Larry B. Wallnau
Publisher:
Cengage Learning

Elementary Statistics: Picturing the World (7th E…
Statistics
ISBN:
9780134683416
Author:
Ron Larson, Betsy Farber
Publisher:
PEARSON

The Basic Practice of Statistics
Statistics
ISBN:
9781319042578
Author:
David S. Moore, William I. Notz, Michael A. Fligner
Publisher:
W. H. Freeman

Introduction to the Practice of Statistics
Statistics
ISBN:
9781319013387
Author:
David S. Moore, George P. McCabe, Bruce A. Craig
Publisher:
W. H. Freeman