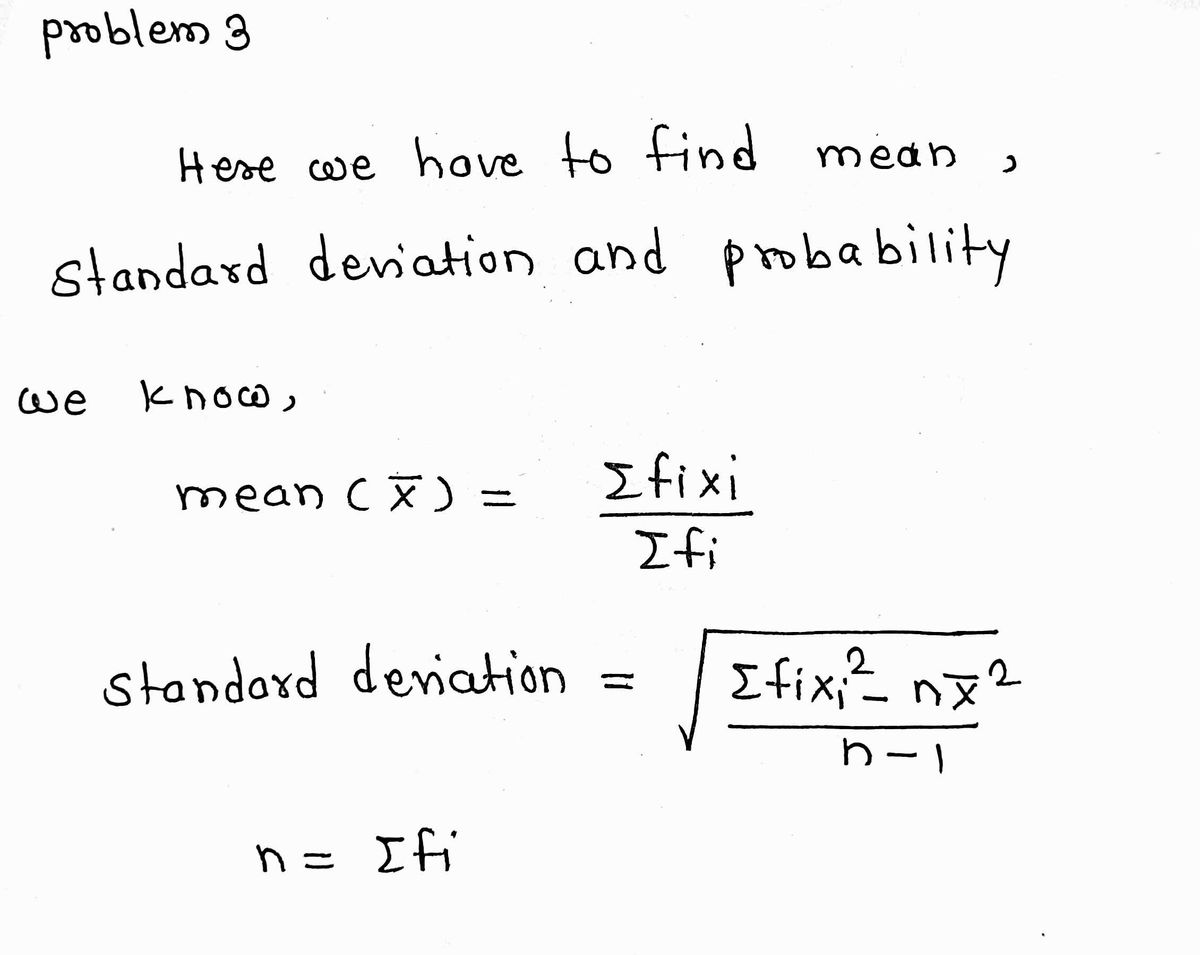
Continuation of problem-3. Given the following annual sample data, determine the mean delivery time, variance and standard deviation of the delivery time, and the probability of a delivery occurring in four or fewer days.
Q: Answer the following multiple choice questions. You must show some relavent work and/or explanation…
A: In a one-Way ANOVA, error variability is computed as the sum of the squared errors(SSE),for all…
Q: 2. We are given data 124 ; 58 ; 215 ; 123 ; 79 ; 68 ; 82 ; 130 ; 128 ; 150 132 ; 69 ; 132 ; 115 ;…
A:
Q: 1.A distribution of sample means with scores of 35 were taken from a skewed population. The…
A: 1) We know that if the distribution of the population is skewed then the distribution of sample…
Q: 16. Analysis of a set of experiments gives an estimated variance within groups, based on 20 degrees…
A: Given: Degree of freedom (Within) = 20 Variance within groups = 4.55 Degree of freedom (between) =…
Q: State two advantages of using a sample statistic rather than a parameter.
A: The numerical value that describes the characteristics of a population as a whole is defined as the…
Q: simple random sample comprised of the following data: 55, 23, 15, 6, 31. What is the point estimate…
A: Given that Data - 55, 23, 15, 6, 31. Number of data values (n) = 5 Sum of data value = 55+…
Q: What is the mean of Class A and B? What are the standard deviation and variance of Class A and B?…
A:
Q: 2) If all of the values in a set of data were doubled, what would happen to the variance?
A: We need to use the concept of variance.
Q: 1. Describe the sources of variability in a random experiment
A: If in each trial of an experiment conducted under identical conditions, the outcome is not unique,…
Q: When solving a problem related to one sample and the confidence interval of variance. Which table…
A:
Q: Topic: CENTRALIZATION AND DISPERSION MEASURES DISCRETE VARIABLE In a group of families considering…
A: We can create the table according to the weight of every observation. No. of Children(X) Weight…
Q: In an ANOVA setting, the choose your answer... sum of squares measures the variability of the…
A: In an Analysis of Variance (ANOVA) setting, there are typically two primary types of variability we…
Q: A relatively new breed of cat that first appeared in China frequently suffers from joint problems.…
A:
Q: Say whether this or that example describes the use of descriptive or inferential statistics. 1.…
A: Since you have asked multiple subparts questions, we will solve first three subparts for you. To get…
Q: 27.5, 27, 26, 26, 25, 25, 25, 24.5, 24, 23, 22, 21, 19.5, Summary Statistics (Descriptive…
A: A. Number of observations: 13 B. Measures of Central Tendencies: Mean is the average of the…
Q: The analysis of variance (ANOVA) is a procedure that allows statisticians to compare three or more…
A: ANOVA stands for Analysis of Variance. It is a statistical method that separates observed variance…
Q: 8. Alternate Sources of Fuel Eighty-five percent of Americans favor spending government money to…
A:
Q: a. Find the mean. The mean is (Type an integer or a decimal rounded to one decimal place as…
A: Given: Selling price, X 1000 1900 1150 1900 1550 1050 1900 1450 1050 1100…
Q: What are the range, variance, and standard deviation of 0, 5, 10, 15, 20, and 25?
A: The following information has been given: 0, 5, 10, 15, 20, 25
Q: Calculate the Variance Number of Courses 1 2 3 4 Probability 0.42 0.12 0.13 0.33
A: Number of coursesProbability10.4220.1230.1340.33
Q: Next, the professor realizes she has other data that may be useful in understanding student grades.…
A: Note: Hi there! Thank you for posting the question. As your question has more than 3 parts, we have…
Q: C4. Your task is to construct a report regarding the number of federal arrests by offense and year…
A: Answer:-----. Date:-----01/10/2021
Q: C4. Your task is to construct a report regarding the pumber of federal arrests by offense and year…
A: The data provided in this question is Type of Offense FY2015 FY2016 Violent 3457 3463…
Q: B. A sample data has a distribution that has a single mode and is strongly positively skewed. An…
A: A distribution is said to be positively skewed if it has a tail elongated toward right. For…
Q: How can I find the Sum of Squares, Variance, and Standard Deviation for the following population.…
A: Here, n is the number of observations. Hence, n is 7. The mean is calculated below.
Q: 24. If an analysis of variance is used for the following data, what would be the effect of changing…
A: 24. The formula for sum of squares within(Error) is SSwithin=∑SSi. When the value of SS2 changing…
Q: Please show all steps. Do not round until last calculation. Determine a strategy to analyze the data…
A: Survival timeSexLog White blood cell countTreatmentLog white blood…
Q: The mode is the only measure of central location for a distribution of a nominal (categorical)…
A:
Q: What statistical method would you use when your variables are nominal and your measure of central…
A: Nominal variables are qualitative variables with categories having no natural ordering in it. For a…
Q: The distribution of the number of personal time off (PTO) days per year offered by different U.S.…
A:
Q: 2. If the mean and variance of a Binomial distribution are 9 and 6 respectively, find the number of…
A: Step 1: Start with the formulas for mean and variance of a Binomial distribution:Mean (μ) =…
Q: What is the population variance and standard deviaition of the following data? 3, 6, 10, 12, 14
A:
Q: 2. You have following observations -1.5, 2.6, 1.2, -2.1, 0.1, 0.9. Find a sample mean, a = variance,…
A: x (x-xbar)^2 -1.5 2.89 2.6 5.76 1.2 1 -2.1 5.29 0.1 0.01 0.9 0.49
Q: In two-way ANOVA, identify what we mean bya. a cell mean.b. a marginal mean.c. an interaction plot.
A: (a)Cell mean:The cell mean represents the mean of the observations of a sample taken from the…
Q: If you observe the values of a normally distributed variable for a sample, a normal probability plot…
A: Requirement of normal distribution:If the plot is roughly linear then the variable is approximately…
Q: A relatively new breed of cat that first appeared in China frequently suffers from joint problems.…
A: Given Information: A new breed of cat that first appeared frequently in China suffers from joint…
Q: Given a normal population with mean = 39 and variance = 16, what is the probability of obtaining an…
A:
Q: 3 4 2 5 4 5 5 7 7 8 5 6 8 6. 7 2 2 5 8 0 6 7 8
A:
Q: 8. The hourly wage for Georgia Tech student interns with statistics training has a known mean of $50…
A: Given Information: Hypothesized value of population mean is 50. Sample size n=16 Sample mean x¯=52…
Step by step
Solved in 2 steps with 3 images
- Styles Scenario: A students takes the following quiz by taking random guesses. Quiz Instructions: Select the corresponding character to the corresponding number: Question #1: b) b) во c) 55 d) 12 e)56 f) The answer is not included. Question #2: b) b) 81 c) 55 d) 72 e)56 f) The answer is not included Question #3: b) 5 b) B1 ) 5 d) 72 e)65 f) The answer is not included Question #4: a) b) 81 c) 55 d) 72 e)65 f) The answer is not included Question #5: a) b) 11, c) 15, d) 72 e)65 The answer is not included n FoCus HIF 5. 5. 1 1 1 0The expected relative frequency of a particular outcome is?6. A. 1. Illustrate the mean or expected value. 2. Illustrate the variance and standard deviation. II III 3 4 5. 6 7 8 10 11 12 13 14
- B. A sample data has a distribution that has a single mode and is strongly positively skewed. An analyst computes three measures of location for this data; the mean, the median and mode. (i) State the largest of these three location measures. (ii) Suggest, with a reason, which would be the best measure of location.Students from undergraduate class were asked to rate how fearful they were of the Biochemistry course, using a scale from 0 to 10. Table 1 and Table 2 shows the data for the students by gender. (c) Table 1 Frequency (male) 1 Scale 5 7 10 1 Total 4 Table 2 Frequency (female) 3 Scale 6. 4 7 2 8. 3 9 Total 14Give a brief example of both a theoretical distribution of data.
- Is this correct?when computing descriptive statistics, we are interested only both describing our data and also in presenting the means and standard deviations of all dependent variables. True or false When writing your participant section, you include all measures of central tendency (mean, median, mode) and all measures of variablility (variance, range, standard deviation). True or falsewhat is the variance of the mean squared errors for this data set