Consider the market for tilapia. Ripple Rock Fish Farms, a small family fishery in Ohio, and The Fishin’ Company, a large corporate supplier, are both producers of tilapia. The marginal cost curves for both firms are shown in the accompanying graph. a. Suppose the market price of tilapia is $2.50 per pound. Move point A to Ripple Rock’s quantity sold. Move point B to The Fishin’ Company’s quantity sold. b. How many pounds of tilapia do they collectively supply? ______ thousand pounds c. To achieve efficient production, The Fishin’ Company should supply _______ ((the same amount of tilapia, more tilapia than, less tilapia than) it is currently producing, and Ripple Rock should supply ________(the same amount of tilapia, more tilapia than, less tilapia than) it is currently producing.


Correlation
Correlation defines a relationship between two independent variables. It tells the degree to which variables move in relation to each other. When two sets of data are related to each other, there is a correlation between them.
Linear Correlation
A correlation is used to determine the relationships between numerical and categorical variables. In other words, it is an indicator of how things are connected to one another. The correlation analysis is the study of how variables are related.
Regression Analysis
Regression analysis is a statistical method in which it estimates the relationship between a dependent variable and one or more independent variable. In simple terms dependent variable is called as outcome variable and independent variable is called as predictors. Regression analysis is one of the methods to find the trends in data. The independent variable used in Regression analysis is named Predictor variable. It offers data of an associated dependent variable regarding a particular outcome.
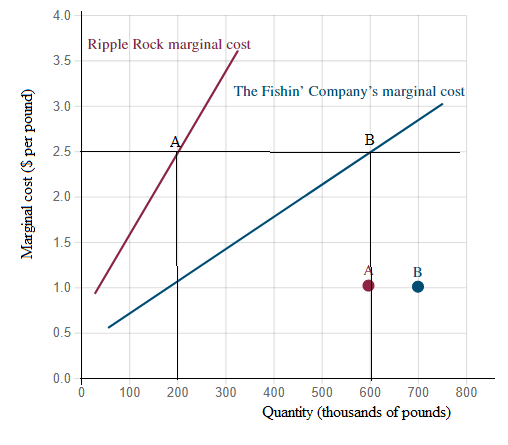
Consider the market for tilapia. Ripple Rock Fish Farms, a small family fishery in Ohio, and The Fishin’ Company, a large corporate supplier, are both producers of tilapia. The marginal cost curves for both firms are shown in the accompanying graph.
a. Suppose the market price of tilapia is $2.50 per pound. Move point A to Ripple Rock’s quantity sold. Move point B to The Fishin’ Company’s quantity sold.

Given, the market for tilapia, there are two producers.
a)
At market price, P = $2.50, Ripple rock produces 200 units of tilapia and the Fishin' company produces 600 units of tilapia. At these output level, price line cut their respective marginal cost curve at point A and B.
In the graph below, these points are shown:

Trending now
This is a popular solution!

Step by step
Solved in 2 steps with 1 images


